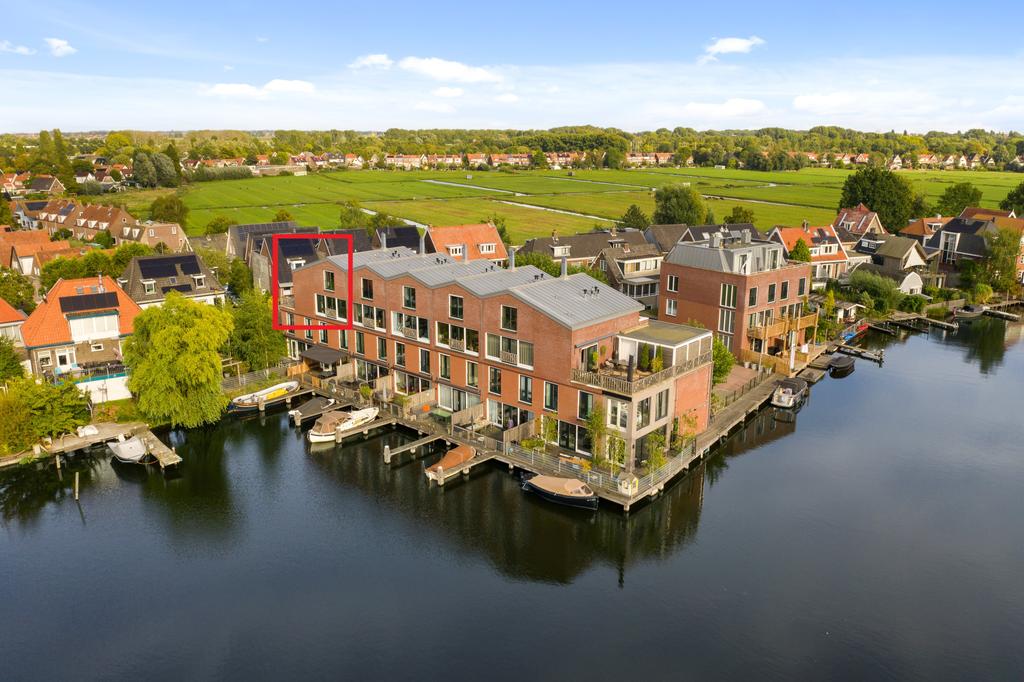
Listed on Funda since 6 Jun 2026
Landsmeerderdijk 20E
1035PW Amsterdam · Kadoelen
- Asking price
- €1,000,000
- €6,250 per m²
- Our estimate
- €1,182,784
- Likely €1.04m – €1.35m
- WOZ value 2025
- €972,000
- +192% since 2014
Below the range. The asking price is below our modelled value band for this address. 73% of the homes sold in Groot-Amsterdam in Q3 2026 went for more than the asking price.
Key facts
- Floor area
- 160 m²
- Plot area
- Unknown
- Volume
- 548 m³
- Rooms
- 3
- Bedrooms
- 2
- Own plot
- No
- Build year
- 2011
- Roof type
- Pitched
- Energy label
- A
- VvE contribution
- €260.00 p/m
- Ownership
- Freehold
Overall score
Strongest: House, Amenities & schools. Weakest: Crime, Costs.
How to read the grades
Each theme scores from 0 to 100, with a letter from A to E. Higher is always better for the buyer — so on Costs, a low score means expensive. The overall figure is the average of the theme scores, not a ranking.
- HouseScore 75 out of 100 (B)Floor area: 153 m² · Build year: 2010
- CostsScore 36 out of 100 (D)Water authority charges: € 59 / month · Property tax (OZB): € 49 / month
- ResidentsScore 40 out of 100 (C)Serious noise annoyance from neighbours: 5.1% · Satisfied with their home: 90.1%
- CrimeScore 32 out of 100 (D)Crimes per 1,000 residents: 42.0 per 1,000
- Amenities & schoolsScore 68 out of 100 (B)Primary school: 296 m · GP practice: 645 m
- EnvironmentScore 52 out of 100 (C)Serious noise annoyance from aircraft: 12.9% · Air quality: particulate matter (PM10): 15.9 µg/m³
What speaks for it· 8
- Primary school 296 m — Close · Amenities & schools
- Floor area 153 m² — High · House
- GP practice 645 m — Close · Amenities & schools
- Build year 2010 — Built under the Bouwbesluit (EPC era) · House
- Air quality: particulate matter (PM10) 15.9 µg/m³ — Clean air · Environment
- Air quality: particulate matter (PM2.5) 8.6 µg/m³ — Clean air · Environment
- Flood probability — Chance below 1 in 3,000 per year · Environment
- Air quality: nitrogen dioxide (NO2) 16.6 µg/m³ — Clean air · Environment
What to look into· 8
- Water authority charges — € 59 / month · Costs
- Serious noise annoyance from aircraft 12.9% — Higher than 95% of neighbourhoods · Environment
- Property tax (OZB) — € 49 / month · Costs
- Waste collection charge — € 33 / month · Costs
- Maintenance reserve — € 195 / month · Costs
- Buildings insurance — € 14 / month · Costs
- Serious noise annoyance from road traffic 9.4% — Higher than 79% of neighbourhoods · Environment
- Cooling down indoors in hot weather 54.5% — Higher than 24% of neighbourhoods · Environment
Compare
Next to another address.
Add your current address, or another house you're considering, to see what differs.
Price
What this address is worth.
Estimated market value
Estimated market value
A statistical estimate, not a valuation. The model starts from this dwelling's official WOZ value and corrects it with CBS figures: the gap between WOZ values and actual sale prices in this municipality, how the housing market has moved since, and how this dwelling compares per m² with what is typical for this neighbourhood. Each of those steps carries its own uncertainty, and the model carries it through — which is why the figure comes with a range rather than a single hard number. Condition, renovations and interior quality appear in no source, and so are not in this estimate either.
- Original value
- € 1,182,784
- Source
- CBS 86165NED (WOZ-waarden), 83625NED (verkoopprijzen woningen), 85773NED (prijsindex bestaande koopwoningen)Retrieved on 9 September 2026 · Licence: CC0More about this source
€ 1,182,784
22% above the WOZ value
Moderate confidence
- WOZ value
- € 972,000
WOZ value
The WOZ value is the municipality's assessed value of the property, used for (among other things) property tax.
- Original value
- € 972,000
- Source
- WOZ-waardeloket (Kadaster LV-WOZ)Retrieved on 20 October 2026 · Licence: CC0More about this source
- Reference date
- 1 January 2025
- Since 2014
- +192%
- Likely range
- €1,036,595 – €1,349,589
4 out of 5 homes like this one sell within this range.
Asking price
€1,000,000
Below the rangeThe asking price is below our modelled value band for this address.
The market in Groot-Amsterdam
Figures from NVM estate agents for Q3 2026
- Sale price per m²
- €7,401/m²
Of the homes sold in Groot-Amsterdam in Q3 2026, half went for more than €7,401 per m² of living area and half for less. All dwelling types combined.
- Asking vs sale price
- +5%
The final sale price in Groot-Amsterdam came in 5% above the last asking price. Budget for that.
- Sold above asking
- 73%
73% of the homes sold in Groot-Amsterdam in Q3 2026 went for more than the asking price.
Sale price per m² by dwelling type
- Terraced house
- €5,222/m²
- End-of-terrace house
- €5,415/m²
- Semi-detached house
- €5,541/m²
- Detached house
- €5,787/m²
- Apartment
- €8,221/m²
Figures from NVM estate agents covering existing owner-occupied homes in COROP region Groot-Amsterdam, Q3 2026. A region spans dozens of municipalities, so this describes the surrounding market, not this street or this house.
WOZ value, 2014 – 2025
From €333,000 to €972,000
| Reference date | WOZ value |
|---|---|
| 1 January 2014 | €333,000 |
| 1 January 2015 | €356,500 |
| 1 January 2016 | €400,500 |
| 1 January 2017 | €486,000 |
| 1 January 2018 | €623,000 |
| 1 January 2019 | €674,000 |
| 1 January 2020 | €705,000 |
| 1 January 2021 | €791,000 |
| 1 January 2022 | €977,000 |
| 1 January 2023 | €956,000 |
| 1 January 2024 | €870,000 |
| 1 January 2025 | €972,000 |
House
The building and its condition.
Floor area
Floor area
The usable floor area of the dwelling, as registered in the BAG.
- Original value
- 153 m²
- Sits at the 80.1th percentile for the Netherlands.
- Source
- BAG (Basisregistratie Adressen en Gebouwen)Retrieved on 19 October 2026 · Licence: CC0More about this source
153 m²
Build year
Build year
The building's construction year, as registered in the BAG. The bands follow the building requirements in force at the time: no insulation requirements (before 1976), the first insulation requirements (1976-1991), the Bouwbesluit with EPC (1992-2020) and BENG (2021 onwards). So it says what was required then — not how this building performs now, which may have been improved since.
- Original value
- 2010
- Sits at the 70th percentile.
- Source
- BAG (Basisregistratie Adressen en Gebouwen)Retrieved on 19 October 2026 · Licence: CC0More about this source
2010Built under the Bouwbesluit (EPC era)
Build-year points of attention
Build-year points of attention
An overview of build-year-related points to raise during the building survey — not a finding of defects in this specific dwelling, and not a substitute for a survey.
- Original value
- For a dwelling built in 2010, this build-year overview has no known points of attention — this is not a substitute for a building survey.
- Source
- HuisWeter-bouwjaar-checklist (Milieu Centraal, RIVM, Instituut Asbestslachtoffers, vakliteratuur bouwkundige keuring)Retrieved on 8 September 2026 · No open licence (source cited for context)More about this source
For a dwelling built in 2010, this build-year overview has no known points of attention — this is not a substitute for a building survey.
Running costs
What living here costs.
The dwelling's own monthly costs: municipal levies, water authority charges, energy, maintenance and insurance. No mortgage.
Total monthly costs (excluding mortgage)
Total monthly costs (excluding mortgage)
The sum of the house-intrinsic monthly costs above: municipal levies, water authority charges, energy, maintenance reserve and buildings insurance. NO mortgage: that depends on the buyer (deposit, rate, term), not the house, and is deliberately excluded here.
- Original value
- € 503
- Higher than 52.1% of all Dutch neighbourhoods.
- Source
- HuisWeter-model: som van de woninggebonden maandlastenRetrieved on 8 September 2026 · No open licence (source cited for context)More about this source
€ 503± € 503 / month, made up of: OZB, sewerage, waste collection, water authority charges, energy, maintenance reserve, buildings insurance.
Any mortgage is excluded.
Property tax (OZB)
Property tax (OZB)
The municipal property tax for owners, estimated as an average effective rate for this gemeente (total OZB revenue from dwellings divided by the total WOZ value of the housing stock) applied to this dwelling's own WOZ value.
- Original value
- € 49 / month
- Higher than 81.2% of all Dutch neighbourhoods.
- Source
- HuisWeter-model: gemeentelijke OZB-opbrengst (CBS 83642NED) x WOZ-waardeRetrieved on 8 October 2026 · Licence: CC0More about this source
€ 49 / month
Sewerage charge
Sewerage charge
The municipal sewerage charge, estimated as the average amount per household in this gemeente (total sewerage revenue divided by the number of households).
- Original value
- € 19 / month
- Higher than 32.7% of all Dutch neighbourhoods.
- Source
- HuisWeter-model: gemeentelijke rioolheffing-opbrengst (CBS 83642NED)Retrieved on 8 October 2026 · Licence: CC0More about this source
€ 19 / month
Waste collection charge
Waste collection charge
The municipal waste collection charge, estimated as the average amount per household in this gemeente (total revenue divided by the number of households).
- Original value
- € 33 / month
- Higher than 80.9% of all Dutch neighbourhoods.
- Source
- HuisWeter-model: gemeentelijke afvalstoffenheffing-opbrengst (CBS 83642NED)Retrieved on 8 October 2026 · Licence: CC0More about this source
€ 33 / month
Water authority charges
Water authority charges
The water authority charges (watersysteemheffing and zuiveringsheffing). This product does not know this specific address's own water authority, so this is the NATIONAL AVERAGE rate across all 21 Dutch water authorities, not your own authority's actual rate.
- Original value
- € 59 / month
- Higher than 98.5% of all Dutch neighbourhoods.
- Source
- HuisWeter-model: landelijk gemiddelde waterschapstarieven (CBS 80892NED)Retrieved on 12 October 2026 · Licence: CC0More about this source
€ 59 / month
Energy (gas and electricity)
Energy (gas and electricity)
Estimated energy use: the average gas and electricity use of this type of dwelling (flat, terraced, end-of-terrace, semi-detached or detached) in this gemeente, according to CBS, at current national-average energy tariffs. The type comes from the energy label; without one it is the average over every dwelling in the gemeente. An average, not a bill.
- Original value
- € 134 / month
- Source
- CBS 81528NED (energieverbruik per woningtype en gemeente) x landelijke energietarieven (CBS 85592NED)Retrieved on 12 October 2026 · Licence: CC0More about this source
€ 134 / month
An average over every dwelling in the gemeente (type unknown: no energy label), not a bill: household size, a heat pump or an electric car make a big difference.
Maintenance reserve
Maintenance reserve
A recommended monthly maintenance reserve, estimated as 0.85%/year of the rebuild value (floor area x an assumed rebuild cost per m²). This is a rule-of-thumb figure, not a measured one.
- Original value
- € 195 / month
- Higher than 79.1% of all Dutch neighbourhoods.
- Source
- HuisWeter-model: onderhoudsreserve (0,85%/jaar van aangenomen herbouwwaarde)Retrieved on 8 September 2026 · No open licence (source cited for context)More about this source
€ 195 / month
Buildings insurance
Buildings insurance
An estimated monthly buildings-insurance premium, as a percentage of the assumed rebuild value. This is a rule-of-thumb figure, not a quote.
- Original value
- € 14 / month
- Higher than 79.1% of all Dutch neighbourhoods.
- Method
- Estimated as a percentage of the same assumed rebuild value as the maintenance reserve (€ 275,400). A rule of thumb, not an insurer's quote.
- Source
- HuisWeter-model: opstalverzekering (percentage van aangenomen herbouwwaarde)Retrieved on 8 September 2026 · No open licence (source cited for context)More about this source
€ 14 / month
The verdict on water authority charges follows directly from the WOZ value; the ranking is the WOZ value's, not separate evidence. The verdict on maintenance reserve and buildings insurance follows directly from the floor area; the ranking is the floor area's, not separate evidence.
Residents
Who lives around here.
Population density
Population density
The number of residents per square kilometre of land area in this neighbourhood. This reflects how urban or rural the surroundings feel — not a quality judgement, more a matter of taste.
- Original value
- 2,110 / km²
- Source
- CBS Kerncijfers wijken en buurten (KWB) 2025Retrieved on 18 October 2026 · Licence: CC-BY 4.0More about this source
2,110 / km²
- 58%
- lower than in Amsterdam
- 4,968 / km²
- ×3.9
- as high as in the Netherlands
- 536 / km²
Surrounding address density
Surrounding address density
The average number of addresses per square kilometre within a 1 km radius of each address in the neighbourhood — the measure CBS uses to classify urbanity. Like population density, this is informational, not a quality judgement.
- Original value
- 2,017 / km²
- Source
- CBS Kerncijfers wijken en buurten (KWB) 2025Retrieved on 18 October 2026 · Licence: CC-BY 4.0More about this source
2,017 / km²
- 67%
- lower than in Amsterdam
- 6,130 / km²
- 3%
- lower than in the Netherlands
- 2,082 / km²
Average household size
Average household size
The average number of people per household in this neighbourhood, as CBS publishes it. A low figure points to many single people or couples, a higher one to more families. A characteristic of the area, not a quality judgement.
- Original value
- 2.6 people
- Source
- CBS Kerncijfers wijken en buurten (KWB) 2025Retrieved on 18 October 2026 · Licence: CC-BY 4.0More about this source
2.6 people
- 44%
- higher than in Amsterdam
- 1.8 people
- 24%
- higher than in the Netherlands
- 2.1 people
Satisfied with their home
Satisfied with their home
What is it?
The share of adults (18+) in this neighbourhood who say they are satisfied with their own home. An estimate for the neighbourhood as a whole, not a verdict on this dwelling and not a count of residents.
Why does it matter?
How satisfied residents are with their homes says something about how well the housing in the area fits what people are looking for.
- Original value
- 90.1%
- Higher than 36.6% of all Dutch neighbourhoods.
- Method
- RIVM model estimate (Gezondheidsmonitor 2024) for the adults (18+) in the buurt, derived from national surveys and characteristics of the residents.
- Source
- RIVM Gezondheidsmonitor (CBS 50150NED)Retrieved on 18 October 2026 · Licence: CC-BY 4.0More about this source
90.1%
- 7.4 pp
- higher than in Amsterdam
- 82.7%
- 2.0 pp
- higher than in the Netherlands
- 88.1%
RIVM estimate based on who lives here, not a count.
Satisfied with their surroundings
Satisfied with their surroundings
What is it?
The share of adults (18+) in this neighbourhood who say they are satisfied with their surroundings. An estimate for the neighbourhood as a whole, not a count of residents.
Why does it matter?
This is how residents themselves experience the area: atmosphere, amenities and quiet together. It complements the measured figures with the view of the people who live there.
- Original value
- 91.4%
- Higher than 51.5% of all Dutch neighbourhoods.
- Method
- RIVM model estimate (Gezondheidsmonitor 2024) for the adults (18+) in the buurt, derived from national surveys and characteristics of the residents.
- Source
- RIVM Gezondheidsmonitor (CBS 50150NED)Retrieved on 18 October 2026 · Licence: CC-BY 4.0More about this source
91.4%
- 8.3 pp
- higher than in Amsterdam
- 83.1%
- 4.5 pp
- higher than in the Netherlands
- 86.9%
RIVM estimate based on who lives here, not a count.
Serious noise annoyance from neighbours
Serious noise annoyance from neighbours
What is it?
The share of adults (18+) in this neighbourhood who are seriously annoyed by noise from neighbours. An estimate for the neighbourhood as a whole, not a count of residents.
Why does it matter?
Noise from neighbours depends mostly on construction (sound insulation between homes) and how closely people live together. We cannot measure it at the address itself.
- Original value
- 5.1%
- Higher than 67.6% of all Dutch neighbourhoods.
- Method
- RIVM model estimate (Gezondheidsmonitor 2024) for the adults (18+) in the buurt, derived from national surveys and characteristics of the residents.
- Source
- RIVM Gezondheidsmonitor (CBS 50150NED)Retrieved on 18 October 2026 · Licence: CC-BY 4.0More about this source
5.1%
- 3.0 pp
- lower than in Amsterdam
- 8.1%
- 0.4 pp
- similar to the Netherlands
- 5.5%
3.3% sleep badly because of it (Amsterdam 6.2%, the Netherlands 3.6%) · RIVM estimate based on who lives here, not a count.
Gets support from others
Gets support from others
What is it?
The share of adults (18+) in this neighbourhood who get support from others when needed. An RIVM estimate for the neighbourhood as a whole: a characteristic of the area, not a statement about any resident or household.
Why does it matter?
Support from others shows how strong the social ties in a neighbourhood are.
- Original value
- 94.2%
- Method
- RIVM model estimate (Gezondheidsmonitor 2024) for the adults (18+) in the buurt, derived from national surveys and characteristics of the residents.
- Source
- RIVM Gezondheidsmonitor (CBS 50150NED)Retrieved on 18 October 2026 · Licence: CC-BY 4.0More about this source
94.2%
- 4.2 pp
- higher than in Amsterdam
- 90.0%
- 1.3 pp
- higher than in the Netherlands
- 92.9%
- 18–64
- 94.1%
- 3.9 pp higher than in Amsterdam 90.2%
- 65+
- 94.4%
- 5.0 pp higher than in Amsterdam 89.4%
RIVM estimate based on who lives here, not a count.
Struggles to make ends meet
Struggles to make ends meet
What is it?
The share of adults (18+) in this neighbourhood who struggle to make ends meet. An RIVM estimate for the neighbourhood as a whole: a characteristic of the area, not a statement about any resident or household.
Why does it matter?
It describes the financial position of residents and gives context to the costs and prices in the area.
- Original value
- 14.4%
- Method
- RIVM model estimate (Gezondheidsmonitor 2024) for the adults (18+) in the buurt, derived from national surveys and characteristics of the residents.
- Source
- RIVM Gezondheidsmonitor (CBS 50150NED)Retrieved on 18 October 2026 · Licence: CC-BY 4.0More about this source
14.4%
- 9.5 pp
- lower than in Amsterdam
- 23.9%
- 0.9 pp
- similar to the Netherlands
- 15.3%
- 18–64
- 15.9%
- 9.6 pp lower than in Amsterdam 25.5%
- 65+
- 7.9%
- 7.9 pp lower than in Amsterdam 15.8%
RIVM estimate based on who lives here, not a count.
Informal carer
Informal carer
What is it?
The share of adults (18+) in this neighbourhood who provide informal care. An RIVM estimate for the neighbourhood as a whole: a characteristic of the area, not a statement about any resident or household.
Why does it matter?
Informal care shows how many residents look after someone else besides their own lives.
- Original value
- 12.6%
- Method
- RIVM model estimate (Gezondheidsmonitor 2024) for the adults (18+) in the buurt, derived from national surveys and characteristics of the residents.
- Source
- RIVM Gezondheidsmonitor (CBS 50150NED)Retrieved on 18 October 2026 · Licence: CC-BY 4.0More about this source
12.6%
- 3.4 pp
- higher than in Amsterdam
- 9.2%
- 1.1 pp
- lower than in the Netherlands
- 13.7%
- 18–64
- 11.9%
- 3.4 pp higher than in Amsterdam 8.5%
- 65+
- 15.9%
- 2.9 pp higher than in Amsterdam 13.0%
RIVM estimate based on who lives here, not a count.
Volunteering
Volunteering
What is it?
The share of adults (18+) in this neighbourhood who do volunteer work. An RIVM estimate for the neighbourhood as a whole: a characteristic of the area, not a statement about any resident or household.
Why does it matter?
Volunteering is a sign of how active residents are in their area.
- Original value
- 23.2%
- Method
- RIVM model estimate (Gezondheidsmonitor 2024) for the adults (18+) in the buurt, derived from national surveys and characteristics of the residents.
- Source
- RIVM Gezondheidsmonitor (CBS 50150NED)Retrieved on 18 October 2026 · Licence: CC-BY 4.0More about this source
23.2%
- 5.9 pp
- higher than in Amsterdam
- 17.3%
- 1.5 pp
- lower than in the Netherlands
- 24.7%
- 18–64
- 22.1%
- 5.8 pp higher than in Amsterdam 16.3%
- 65+
- 28.1%
- 6.0 pp higher than in Amsterdam 22.1%
RIVM estimate based on who lives here, not a count.
Who lives here
Kadoelen · 2,515 residents
edition 2026Residents by age group
Households
Average household size: 2.6
Marital status
Counts every resident, children included; children count as never married.
Education level of residents aged 15 to 75
Pupils and students
Residents by country of origin
Residents by country of origin
| Country of origin | 2026 | Change |
|---|---|---|
| Netherlands | 69.8% (1,755) | −1.5 pp |
| Outside Europe | 20.3% (510) | +1.1 pp |
| Europe (excluding the Netherlands) | 9.9% (250) | +0.4 pp |
The series starts in 2023: this buurt was given a different code then, so older figures cannot be linked to it.
Figures from CBS Kerncijfers Wijken en Buurten for the buurt Kadoelen (2,515 residents). Percentages are calculated over the sum of the categories shown, not over the total population: CBS rounds every count to a multiple of five, so the two need not be equal. Not every block comes from the same edition; each block states which edition it comes from. A published 0 means 0, 1 or 2 residents, not 'none'. Every figure describes the neighbourhood as a whole, not a street, a household or a person. Editions read: 2023, 2024, 2025, 2026.
Source: CBS Kerncijfers wijken en buurten (KWB), edities 2023-2026
Crime
What is registered in the area.
Crimes per 1,000 residents
Crimes per 1,000 residents
The number of registered crimes per 1,000 residents, across the NEIGHBOURHOOD this address is in (not the municipality) — the finest breakdown police/CBS publish for registered crime. The figure is ranked against every other Dutch neighbourhood: half of them sit below 27 crimes per 1,000 residents, a quarter above 52. This describes an area as a whole, not this specific address or the people living there.
- Original value
- 42.0 per 1,000
- Higher than 67.9% of all Dutch neighbourhoods.
- Method
- The buurt (neighbourhood) Kadoelen (not the municipality or street) — the finest breakdown police/CBS publish for registered crime. 103 registered crimes in 2025 divided by 2,455 residents, times 1,000.
- Source
- CBS/Politie: Geregistreerde misdrijven; soort misdrijf, wijk, buurt (47018NED)Retrieved on 19 October 2026 · Licence: CC0More about this source
Kadoelen · 2025
42.0per 1,000 residents
−32% registered crimes since 2019
Higher than 68% of neighbourhoods in the Netherlands (median 27.1)
- Theft and burglary 17.5
- Traffic 11.0
- Violence and threats 5.7
- +4 more
Crimes are counted where they happen, not where those involved live: a buurt with shops, nightlife or a station also counts offences against people who do not live there. CBS does not publish four crime types at buurt level (sexual offences among them); these are included in the total and in the 'other and withheld' category, but cannot be shown separately.
Registered crimes per 1,000 residents per year
Kadoelen, 2019–2025
| Year | Per 1,000 residents | Number of crimes |
|---|---|---|
| 2019 | 61.5 | 151 |
| 2020 | 61.9 | 152 |
| 2021 | 48.1 | 118 |
| 2022 | 47.3 | 116 |
| 2023 | 55.0 | 135 |
| 2024 | 49.3 | 121 |
| 2025 | 42.0 | 103 |
Crimes per 1,000 residents
Kadoelen, 2025
| Category | Per 1,000 | Count |
|---|---|---|
| Theft and burglary | 17.5 | 43 |
| Vandalism and public order | 2.4 | 6 |
| Violence and threats | 5.7 | 14 |
| Fraud and scams | 3.3 | 8 |
| Traffic | 11.0 | 27 |
| Environmental | 0.4 | 1 |
| Other and withheld | 1.6 | 4 |
Home burglaries
Home burglaries
The number of registered home burglaries per year per 1,000 homes in the NEIGHBOURHOOD this address is in, averaged over the last three published years — a single year is too small in one neighbourhood to compare on. The figure is ranked against every other Dutch neighbourhood: half sit below 2.0 per 1,000 homes, a quarter above 3.9, and a quarter registered no home burglary at all in three years. Home burglaries are also part of the total above, so this figure does not count separately towards the score. It describes an area, not this address.
- Original value
- 4.1 per 1,000 homes
- Higher than 76.3% of all Dutch neighbourhoods.
- Source
- CBS/Politie: Geregistreerde misdrijven; soort misdrijf, wijk, buurt (47018NED)Retrieved on 19 October 2026 · Licence: CC0More about this source
4.1per 1,000 homes per year
11 home burglaries in 2023–2025
Higher than 76% of neighbourhoods in the Netherlands (median 2.0)
The buurt (neighbourhood) of Kadoelen — not the street or the address — from CBS/Politie 47018NED. The trend shows registered crimes per 1,000 residents per year over the last 7 published years. Every year is divided by the same population (2,455), because no matching population figure is available for earlier years: the line therefore shows how recorded crime moved, not how crime per resident moved. The breakdown by type covers 2025, divided by 2,455 residents, times 1,000. The 'other and withheld' category is the published total minus the summed categories, so the bars add up to the total exactly.
Source: CBS/Politie: Geregistreerde misdrijven; soort misdrijf, wijk, buurt (47018NED)
Health
How healthy residents say they are.
How the adults in this neighbourhood experience their health and their lives, according to RIVM's Gezondheidsmonitor, and how far the nearest GP, pharmacy, dentist, physiotherapist and hospital are from this address. Without a score and not counted in the overall grade.
Good self-rated health
Good self-rated health
What is it?
The share of adults (18+) in this neighbourhood who rate their own health as good. An RIVM estimate for the neighbourhood as a whole: a characteristic of the area, not a statement about any resident or household.
Why does it matter?
It gives a picture of the neighbourhood's population, for instance how old and how vulnerable it is on average. It says nothing about this dwelling.
- Original value
- 78.2%
- Method
- RIVM model estimate (Gezondheidsmonitor 2024) for the adults (18+) in the buurt, derived from national surveys and characteristics of the residents.
- Source
- RIVM Gezondheidsmonitor (CBS 50150NED)Retrieved on 18 October 2026 · Licence: CC-BY 4.0More about this source
78.2%
- 5.9 pp
- higher than in Amsterdam
- 72.3%
- 5.4 pp
- higher than in the Netherlands
- 72.8%
- 18–64
- 80.7%
- 5.5 pp higher than in Amsterdam 75.2%
- 65+
- 67.1%
- 9.4 pp higher than in Amsterdam 57.7%
RIVM estimate based on who lives here, not a count.
Long-term condition
Long-term condition
What is it?
The share of adults (18+) in this neighbourhood who have one or more long-term conditions. An RIVM estimate for the neighbourhood as a whole: a characteristic of the area, not a statement about any resident or household.
Why does it matter?
A high share can go with an older population. It is a characteristic of the residents, not a quality of the area.
- Original value
- 30.8%
- Method
- RIVM model estimate (Gezondheidsmonitor 2024) for the adults (18+) in the buurt, derived from national surveys and characteristics of the residents.
- Source
- RIVM Gezondheidsmonitor (CBS 50150NED)Retrieved on 18 October 2026 · Licence: CC-BY 4.0More about this source
30.8%
- 1.9 pp
- lower than in Amsterdam
- 32.7%
- 4.1 pp
- lower than in the Netherlands
- 34.9%
- 18–64
- 27.2%
- 1.8 pp lower than in Amsterdam 29.0%
- 65+
- 46.5%
- 5.4 pp lower than in Amsterdam 51.9%
RIVM estimate based on who lives here, not a count.
Smokes
Smokes
What is it?
The share of adults (18+) in this neighbourhood who smoke tobacco. An RIVM estimate for the neighbourhood as a whole: a characteristic of the area, not a statement about any resident or household.
Why does it matter?
It describes the residents' lifestyle, which goes with their age and income. It says nothing about this dwelling.
- Original value
- 14.6%
- Method
- RIVM model estimate (Gezondheidsmonitor 2024) for the adults (18+) in the buurt, derived from national surveys and characteristics of the residents.
- Source
- RIVM Gezondheidsmonitor (CBS 50150NED)Retrieved on 18 October 2026 · Licence: CC-BY 4.0More about this source
14.6%
- 7.1 pp
- lower than in Amsterdam
- 21.7%
- 2.6 pp
- lower than in the Netherlands
- 17.2%
- 18–64
- 15.5%
- 7.7 pp lower than in Amsterdam 23.2%
- 65+
- 10.8%
- 3.2 pp lower than in Amsterdam 14.0%
RIVM estimate based on who lives here, not a count.
Excessive drinking
Excessive drinking
What is it?
The share of adults (18+) in this neighbourhood who drink more alcohol than the alcohol guideline advises. An RIVM estimate for the neighbourhood as a whole: a characteristic of the area, not a statement about any resident or household.
Why does it matter?
It describes the residents' lifestyle, not a quality of the area.
- Original value
- 5.6%
- Method
- RIVM model estimate (Gezondheidsmonitor 2024) for the adults (18+) in the buurt, derived from national surveys and characteristics of the residents.
- Source
- RIVM Gezondheidsmonitor (CBS 50150NED)Retrieved on 18 October 2026 · Licence: CC-BY 4.0More about this source
5.6%
- 1.6 pp
- lower than in Amsterdam
- 7.2%
- 0.2 pp
- similar to the Netherlands
- 5.8%
- 18–64
- 5.0%
- 1.8 pp lower than in Amsterdam 6.8%
- 65+
- 8.3%
- 0.6 pp similar to Amsterdam 8.9%
RIVM estimate based on who lives here, not a count.
Overweight
Overweight
What is it?
The share of adults (18+) in this neighbourhood who are overweight. An RIVM estimate for the neighbourhood as a whole: a characteristic of the area, not a statement about any resident or household.
Why does it matter?
Being overweight is more common among older residents; the figures per age group below show whether the age mix makes the difference.
- Original value
- 42.8%
- Method
- RIVM model estimate (Gezondheidsmonitor 2024) for the adults (18+) in the buurt, derived from national surveys and characteristics of the residents.
- Source
- RIVM Gezondheidsmonitor (CBS 50150NED)Retrieved on 18 October 2026 · Licence: CC-BY 4.0More about this source
42.8%
- 0.3 pp
- similar to Amsterdam
- 42.5%
- 8.8 pp
- lower than in the Netherlands
- 51.6%
- 18–64
- 40.9%
- 0.8 pp similar to Amsterdam 40.1%
- 65+
- 51.0%
- 3.6 pp lower than in Amsterdam 54.6%
RIVM estimate based on who lives here, not a count.
Anxiety or depression feelings
Anxiety or depression feelings
What is it?
The share of adults (18+) in this neighbourhood who had feelings of anxiety or depression in the last four weeks. An RIVM estimate for the neighbourhood as a whole: a characteristic of the area, not a statement about any resident or household.
Why does it matter?
It gives a picture of the residents' mental wellbeing as a group. It says nothing about any resident or about this dwelling.
- Original value
- 46.1%
- Method
- RIVM model estimate (Gezondheidsmonitor 2024) for the adults (18+) in the buurt, derived from national surveys and characteristics of the residents.
- Source
- RIVM Gezondheidsmonitor (CBS 50150NED)Retrieved on 18 October 2026 · Licence: CC-BY 4.0More about this source
46.1%
- 10.5 pp
- lower than in Amsterdam
- 56.6%
- 1.2 pp
- lower than in the Netherlands
- 47.3%
- 18–64
- 47.6%
- 11.0 pp lower than in Amsterdam 58.6%
- 65+
- 39.7%
- 7.0 pp lower than in Amsterdam 46.7%
RIVM estimate based on who lives here, not a count.
Meets physical activity guideline
Meets physical activity guideline
What is it?
The share of adults (18+) in this neighbourhood who meet the Health Council's physical activity guideline. An RIVM estimate for the neighbourhood as a whole: a characteristic of the area, not a statement about any resident or household.
Why does it matter?
How many residents move enough goes with their age, and partly with the room to walk, cycle and play sport.
- Original value
- 56.3%
- Method
- RIVM model estimate (Gezondheidsmonitor 2024) for the adults (18+) in the buurt, derived from national surveys and characteristics of the residents.
- Source
- RIVM Gezondheidsmonitor (CBS 50150NED)Retrieved on 18 October 2026 · Licence: CC-BY 4.0More about this source
56.3%
- 1.4 pp
- lower than in Amsterdam
- 57.7%
- 8.0 pp
- higher than in the Netherlands
- 48.3%
- 18–64
- 58.1%
- 2.8 pp lower than in Amsterdam 60.9%
- 65+
- 48.2%
- 6.9 pp higher than in Amsterdam 41.3%
RIVM estimate based on who lives here, not a count.
Lonely
Lonely
What is it?
The share of adults (18+) in this neighbourhood who feel lonely. An RIVM estimate for the neighbourhood as a whole: a characteristic of the area, not a statement about any resident or household.
Why does it matter?
Loneliness occurs in every neighbourhood. The figure shows how connected residents feel on average.
- Original value
- 41.8%
- Method
- RIVM model estimate (Gezondheidsmonitor 2024) for the adults (18+) in the buurt, derived from national surveys and characteristics of the residents.
- Source
- RIVM Gezondheidsmonitor (CBS 50150NED)Retrieved on 18 October 2026 · Licence: CC-BY 4.0More about this source
41.8%
- 12.4 pp
- lower than in Amsterdam
- 54.2%
- 5.4 pp
- lower than in the Netherlands
- 47.2%
- 18–64
- 41.2%
- 13.1 pp lower than in Amsterdam 54.3%
- 65+
- 44.3%
- 9.4 pp lower than in Amsterdam 53.7%
RIVM estimate based on who lives here, not a count.
Severely lonely
Severely lonely
What is it?
The share of adults (18+) in this neighbourhood who feel severely lonely. An RIVM estimate for the neighbourhood as a whole: a characteristic of the area, not a statement about any resident or household.
Why does it matter?
Severe loneliness is the heavier form of the figure above.
- Original value
- 10.8%
- Method
- RIVM model estimate (Gezondheidsmonitor 2024) for the adults (18+) in the buurt, derived from national surveys and characteristics of the residents.
- Source
- RIVM Gezondheidsmonitor (CBS 50150NED)Retrieved on 18 October 2026 · Licence: CC-BY 4.0More about this source
10.8%
- 7.2 pp
- lower than in Amsterdam
- 18.0%
- 2.8 pp
- lower than in the Netherlands
- 13.6%
- 18–64
- 11.3%
- 7.3 pp lower than in Amsterdam 18.6%
- 65+
- 9.0%
- 5.8 pp lower than in Amsterdam 14.8%
RIVM estimate based on who lives here, not a count.
Control over their own life
Control over their own life
What is it?
The share of adults (18+) in this neighbourhood who feel moderate to high control over their own life. An RIVM estimate for the neighbourhood as a whole: a characteristic of the area, not a statement about any resident or household.
Why does it matter?
It says something about how self-reliant residents feel. It is a characteristic of the population, not a quality of the area.
- Original value
- 90.7%
- Method
- RIVM model estimate (Gezondheidsmonitor 2024) for the adults (18+) in the buurt, derived from national surveys and characteristics of the residents.
- Source
- RIVM Gezondheidsmonitor (CBS 50150NED)Retrieved on 18 October 2026 · Licence: CC-BY 4.0More about this source
90.7%
- 3.7 pp
- higher than in Amsterdam
- 87.0%
- 3.1 pp
- higher than in the Netherlands
- 87.6%
- 18–64
- 91.7%
- 3.9 pp higher than in Amsterdam 87.8%
- 65+
- 86.3%
- 3.3 pp higher than in Amsterdam 83.0%
RIVM estimate based on who lives here, not a count.
Care near this address
Straight-line distance to the nearest, and how many are within reach. No verdict.
GP practice
Huisartsenpraktijk Meteorensingel
2 within 1 km
GP practice
The straight-line distance from this exact address to the nearest GP practice, wherever it is, according to OpenStreetMap. This is NOT a walking or cycling route: water, a railway, or a building in between can make the real distance longer. Nor is it a neighbourhood average: the measurement starts at this front door. Beneath it: the name, and how many lie within 1 km of this address. OpenStreetMap is volunteer-maintained; a newly opened or not-yet-mapped location will be missing, and nothing here says whether it is taking new patients. No verdict is given.
- Original value
- 645 m
- Source
- OpenStreetMap contributors (via Overpass API)Retrieved on 13 September 2026 · Licence: ODbL 1.0More about this source
Pharmacy
BENU
1 within 1 km
Pharmacy
The straight-line distance from this exact address to the nearest pharmacy, wherever it is, according to OpenStreetMap. This is NOT a walking or cycling route: water, a railway, or a building in between can make the real distance longer. Nor is it a neighbourhood average: the measurement starts at this front door. Beneath it: the name, and how many lie within 1 km of this address. OpenStreetMap is volunteer-maintained; a newly opened or not-yet-mapped location will be missing, and nothing here says whether it is taking new patients. No verdict is given.
- Original value
- 636 m
- Source
- OpenStreetMap contributors (via Overpass API)Retrieved on 13 September 2026 · Licence: ODbL 1.0More about this source
Dentist
Mondhygiëniste Praktijk Jolanda Heerschop
3 within 1 km
Dentist
The straight-line distance from this exact address to the nearest dental practice, wherever it is, according to OpenStreetMap. This is NOT a walking or cycling route: water, a railway, or a building in between can make the real distance longer. Nor is it a neighbourhood average: the measurement starts at this front door. Beneath it: the name, and how many lie within 1 km of this address. OpenStreetMap is volunteer-maintained; a newly opened or not-yet-mapped location will be missing, and nothing here says whether it is taking new patients. No verdict is given.
- Original value
- 622 m
- Source
- OpenStreetMap contributors (via Overpass API)Retrieved on 13 September 2026 · Licence: ODbL 1.0More about this source
Physiotherapist
Mensendieck
2 within 1 km
Physiotherapist
The straight-line distance from this exact address to the nearest physiotherapy practice, wherever it is, according to OpenStreetMap. This is NOT a walking or cycling route: water, a railway, or a building in between can make the real distance longer. Nor is it a neighbourhood average: the measurement starts at this front door. Beneath it: the name, and how many lie within 1 km of this address. OpenStreetMap is volunteer-maintained; a newly opened or not-yet-mapped location will be missing, and nothing here says whether it is taking new patients. No verdict is given.
- Original value
- 659 m
- Source
- OpenStreetMap contributors (via Overpass API)Retrieved on 13 September 2026 · Licence: ODbL 1.0More about this source
Hospital
BovenIJ Ziekenhuis
2 within 5 km
Hospital
The straight-line distance from this exact address to the nearest hospital, wherever it is, according to OpenStreetMap. This is NOT a walking or cycling route: water, a railway, or a building in between can make the real distance longer. Nor is it a neighbourhood average: the measurement starts at this front door. Beneath it: the name, and how many lie within 5 km of this address. OpenStreetMap is volunteer-maintained; a newly opened or not-yet-mapped location will be missing, and nothing here says whether it is taking new patients. No verdict is given. OpenStreetMap also counts specialist and psychiatric hospitals here, and a hospital made up of several buildings counts as one when they share a name and lie within 500 m of each other. It says nothing about which departments there are, or whether there is an emergency department.
- Original value
- 2.0 km
- Source
- OpenStreetMap contributors (via Overpass API)Retrieved on 13 September 2026 · Licence: ODbL 1.0More about this source
Amenities & schools
Shops, care and schools nearby.
How far it is to the nearest supermarket, GP, school and daycare centre, and how many are close by. Measured straight-line from this address, according to OpenStreetMap.
Longer bar = better than elsewhere in the Netherlands
GP practice
Huisartsenpraktijk Meteorensingel
0 within 500 m
2 within 1 km
GP practice
The straight-line distance from this exact address to the nearest GP practice, wherever it is, according to OpenStreetMap. This is NOT a walking or cycling route: water, a railway, or a building in between can make the real distance longer. Nor is it a neighbourhood average — the measurement starts at this front door. OpenStreetMap is volunteer-maintained; a newly opened or not-yet-mapped practice will be missing. Beneath it: how many lie within 500 m of this address, or within 1 km when there are none within 500 m (left out when there are none). The distance is compared with the average road distance in every Dutch neighbourhood (CBS), after converting straight-line to road.
- Original value
- 645 m
- Higher than 22.8% of all Dutch neighbourhoods.
- Source
- OpenStreetMap contributors (via Overpass API)Retrieved on 13 September 2026 · Licence: ODbL 1.0More about this source
School
Primary school
Primary school
The straight-line distance from this exact address to the nearest primary school, wherever it is, according to DUO's school register — every school location in the country is in it. Special education is not counted here. This is NOT a walking or cycling route: water, a railway, or a building in between can make the real distance longer. Nor is it a neighbourhood average — the measurement starts at this front door. Beneath it: how many lie within 500 m of this address, or within 1 km when there are none within 500 m (left out when there are none). The distance is compared with the average road distance in every Dutch neighbourhood (CBS), after converting straight-line to road.
- Original value
- 296 m
- Higher than 19.2% of all Dutch neighbourhoods.
- Source
- DUO Open OnderwijsdataRetrieved on 13 September 2026 · Licence: CC BY 4.0More about this source
IKC Tuindorp
2 within 500 m
Secondary school
Secondary school
The straight-line distance from this exact address to the nearest secondary school, wherever it is, according to DUO's school register — every school location in the country is in it. Special education is not counted here. This is NOT a walking or cycling route: water, a railway, or a building in between can make the real distance longer. Nor is it a neighbourhood average — the measurement starts at this front door. Beneath it: how many lie within 500 m of this address, or within 1 km when there are none within 500 m (left out when there are none). The distance is compared with the average road distance in every Dutch neighbourhood (CBS), after converting straight-line to road.
- Original value
- 1.5 km
- Higher than 43.7% of all Dutch neighbourhoods.
- Source
- DUO Open OnderwijsdataRetrieved on 13 September 2026 · Licence: CC BY 4.0More about this source
Kolom Praktijkcollege Noord
0 within 500 m
0 within 1 km
27 primary schools and 8 secondary schools within 3 km — as the crow flies
Supermarket
Albert Heijn
1 within 500 m
Supermarket
The straight-line distance from this exact address to the nearest supermarket, wherever it is, according to OpenStreetMap. This is NOT a walking or cycling route: water, a railway, or a building in between can make the real distance longer. Nor is it a neighbourhood average — the measurement starts at this front door. OpenStreetMap is volunteer-maintained; a newly opened or not-yet-mapped supermarket will be missing. Beneath it: how many lie within 500 m of this address, or within 1 km when there are none within 500 m (left out when there are none). The distance is compared with the average road distance in every Dutch neighbourhood (CBS), after converting straight-line to road.
- Original value
- 421 m
- Higher than 28% of all Dutch neighbourhoods.
- Source
- OpenStreetMap contributors (via Overpass API)Retrieved on 13 September 2026 · Licence: ODbL 1.0More about this source
Daycare centre
Eigen&Wijzer KDV en Voorschool IKC Tuindorp
2 within 500 m
Daycare centre
The straight-line distance from this exact address to the nearest registered daycare centre, wherever it is, according to the Landelijk Register Kinderopvang — the national register every daycare centre must be in before it may open. This is NOT a walking or cycling route: water, a railway, or a building in between can make the real distance longer. Nor is it a neighbourhood average — the measurement starts at this front door. Beneath it: how many lie within 500 m of this address, or within 1 km when there are none within 500 m (left out when there are none). The distance is compared with the average road distance in every Dutch neighbourhood (CBS), after converting straight-line to road.
- Original value
- 334 m
- Higher than 34.2% of all Dutch neighbourhoods.
- Source
- Landelijk Register Kinderopvang (DUO / SZW)Retrieved on 25 September 2026 · Licence: CC0 1.0More about this source
Playground
4 within 500 m
no verdict
Playground
The straight-line distance from this exact address to the nearest playground, wherever it is, according to OpenStreetMap. This is NOT a walking or cycling route: water, a railway, or a building in between can make the real distance longer. Nor is it a neighbourhood average — the measurement starts at this front door. OpenStreetMap is volunteer-maintained; a not-yet-mapped playground will be missing. Beneath it: how many lie within 500 m of this address, or within 1 km when there are none within 500 m (left out when there are none). No verdict is given: CBS publishes no playground distance to compare it with.
- Original value
- 414 m
- Source
- OpenStreetMap contributors (via Overpass API)Retrieved on 13 September 2026 · Licence: ODbL 1.0More about this source
Train station
Amsterdam Centraal
0 within 500 m
0 within 1 km
no verdict
Train station
The straight-line distance from this exact address to the nearest train station, wherever it is, according to OpenStreetMap. This is NOT a walking or cycling route: water, a railway, or a building in between can make the real distance longer. Nor is it a neighbourhood average — the measurement starts at this front door. Beneath it: the station's name and how many stations lie within 500 m or 1 km. No verdict is given (yet).
- Original value
- 4.0 km
- Source
- OpenStreetMap contributors (via Overpass API)Retrieved on 13 September 2026 · Licence: ODbL 1.0More about this source
Tram or metro stop
Noord
0 within 500 m
0 within 1 km
no verdict
Tram or metro stop
The straight-line distance from this exact address to the nearest tram or metro stop (light rail included), according to OpenStreetMap. This is NOT a walking route: water, a railway, or a building in between can make the real distance longer. Nor does it say how often anything calls there. Beneath it: the stop's name and how many tram and metro stops lie within 500 m or 1 km. No verdict is given.
- Original value
- 2.7 km
- Source
- OpenStreetMap contributors (via Overpass API)Retrieved on 13 September 2026 · Licence: ODbL 1.0More about this source
Bus stop
Appelweg
4 within 500 m
no verdict
Bus stop
The straight-line distance from this exact address to the nearest bus stop, according to OpenStreetMap. This is NOT a walking route: water, a railway, or a building in between can make the real distance longer. Nor does it say how often anything calls there. Beneath it: the stop's name and how many bus stops lie within 500 m or 1 km. No verdict is given.
- Original value
- 215 m
- Source
- OpenStreetMap contributors (via Overpass API)Retrieved on 13 September 2026 · Licence: ODbL 1.0More about this source
Satisfied with the green nearby
Satisfied with the green nearby
What is it?
The share of adults (18+) in this neighbourhood who say they are satisfied with the green in their surroundings. An estimate for the neighbourhood as a whole, not a measurement of the green around this address.
Why does it matter?
Green space nearby invites people outdoors and keeps the surroundings cooler in summer.
- Original value
- 88.2%
- Higher than 45.3% of all Dutch neighbourhoods.
- Method
- RIVM model estimate (Gezondheidsmonitor 2024) for the adults (18+) in the buurt, derived from national surveys and characteristics of the residents.
- Source
- RIVM Gezondheidsmonitor (CBS 50150NED)Retrieved on 18 October 2026 · Licence: CC-BY 4.0More about this source
88.2%
- 10.3 pp
- higher than in Amsterdam
- 77.9%
- 4.1 pp
- higher than in the Netherlands
- 84.1%
RIVM estimate based on who lives here, not a count.
The verdict on supermarket, GP practice, primary school, secondary school and daycare centre compares the distance from this address with the average road distance in every Dutch neighbourhood (CBS 2025; secondary school: 2024). The straight-line distance is converted to a road distance for that. Playground, train station, tram or metro stop and bus stop carry no verdict: no national comparison is used for them.
Amenities within 3 km
Shopping
Health
Children & education
Getting around
- Train station 0
Sport & green
Food & going out
Services
- Post office or point 0
- Police station 0
Counts what has been mapped in OpenStreetMap; a 0 can also mean nobody has mapped it. Schools from the DUO register, daycare from the LRK. Source: OpenStreetMap (extract 2026-09-13), DUO, LRK
Environment
Where this address is exposed.
Road traffic noise (Lden)
Road traffic noise (Lden)
53 dBAverage noise level
What is it?
How much noise road traffic makes at this home's facade on average, over a whole year. Evening and night-time noise counts more heavily, because it is more disturbing then. Measured in decibels (dB): 10 dB more sounds roughly twice as loud.
Why does it matter?
A lot of traffic noise can disturb your sleep and is a common source of annoyance. According to the WHO, living with high noise for years also raises the risk of heart and vascular disease.
Levels
- Very quiet< 45 dB
- Quiet45–50 dB
- Average noise level50–55 dBNow
- Noisy55–65 dB
- Very noisy≥ 65 dB
Where do these limits come from? The WHO advises keeping road-traffic noise below 53 dB. The levels above are steps of 5 to 10 dB around that guideline.
- Method
- National noise map (RIVM Atlas Leefomgeving), published 2025-01-01, model year 2022. A modelled annual average on a national, coarse-resolution grid — not a noise measurement at this exact address.
- Source
- RIVM Atlas LeefomgevingRetrieved on 19 October 2026 · Licence: CC-BY 4.0More about this source
Average noise level (53 dB)
All-source noise (Lden)
All-source noise (Lden)
54 dBAverage noise level
What is it?
How much noise all sources together make at this home's facade on average, over a whole year: road traffic, trains, aircraft and industry. Evening and night-time noise counts more heavily. Measured in decibels (dB): 10 dB more sounds roughly twice as loud.
Why does it matter?
A lot of traffic noise can disturb your sleep and is a common source of annoyance. According to the WHO, living with high noise for years also raises the risk of heart and vascular disease.
Levels
- Very quiet< 45 dB
- Quiet45–50 dB
- Average noise level50–55 dBNow
- Noisy55–65 dB
- Very noisy≥ 65 dB
Where do these limits come from? There is no official standard for noise from all sources combined, so we use the same levels as for road traffic, where the WHO advises staying below 53 dB.
- Method
- National noise map (RIVM Atlas Leefomgeving), published 2025-08-01, model year 2022. A modelled annual average on a national, coarse-resolution grid — not a noise measurement at this exact address.
- Source
- RIVM Atlas LeefomgevingRetrieved on 19 October 2026 · Licence: CC-BY 4.0More about this source
Average noise level (54 dB)
Road traffic noise (Lnight)
Road traffic noise (Lnight)
43 dBAverage noise level
What is it?
How much noise road traffic makes at this home's facade at night (23:00 to 07:00) on average, over a whole year. Measured in decibels (dB).
Why does it matter?
Night-time noise disturbs your sleep, even when it does not wake you. Sleeping badly for a long time can lead to tiredness and health problems.
Levels
- Very quiet< 40 dB
- Average noise level40–55 dBNow
- Very noisy≥ 55 dB
Where do these limits come from? The limits come from the WHO's night-noise guidelines: below 40 dB, nights are quiet enough for healthy sleep. 55 dB is an interim target for places where 40 dB is not (yet) achievable.
- Method
- National noise map (RIVM Atlas Leefomgeving), published 2025-01-01, model year 2022. A modelled annual average on a national, coarse-resolution grid — not a noise measurement at this exact address.
- Source
- RIVM Atlas LeefomgevingRetrieved on 19 October 2026 · Licence: CC-BY 4.0More about this source
Average noise level (43 dB)
Serious noise annoyance from road traffic
Serious noise annoyance from road traffic
What is it?
The share of adults (18+) in this neighbourhood who are seriously annoyed by road traffic. This is how residents experience it, next to the measured decibels above. An estimate for the neighbourhood as a whole.
Why does it matter?
Annoyance is not the same as decibels: the same noise level bothers some people more than others. The figure shows how many residents are bothered.
- Original value
- 9.4%
- Higher than 78.6% of all Dutch neighbourhoods.
- Method
- RIVM model estimate (Gezondheidsmonitor 2024) for the adults (18+) in the buurt, derived from national surveys and characteristics of the residents.
- Source
- RIVM Gezondheidsmonitor (CBS 50150NED)Retrieved on 18 October 2026 · Licence: CC-BY 4.0More about this source
9.4%
- 0.5 pp
- similar to Amsterdam
- 8.9%
- 2.1 pp
- higher than in the Netherlands
- 7.3%
3.9% sleep badly because of it (Amsterdam 4.5%, the Netherlands 3.4%) · RIVM estimate based on who lives here, not a count.
Serious noise annoyance from trains
Serious noise annoyance from trains
What is it?
The share of adults (18+) in this neighbourhood who are seriously annoyed by train traffic. Around 1% almost everywhere, so without a score: it only rises along the railway. An estimate for the neighbourhood as a whole.
Why does it matter?
Train noise matters mainly right next to the railway.
- Original value
- 0.5%
- Method
- RIVM model estimate (Gezondheidsmonitor 2024) for the adults (18+) in the buurt, derived from national surveys and characteristics of the residents.
- Source
- RIVM Gezondheidsmonitor (CBS 50150NED)Retrieved on 18 October 2026 · Licence: CC-BY 4.0More about this source
0.5%
- 1.2 pp
- lower than in Amsterdam
- 1.7%
- 0.5 pp
- similar to the Netherlands
- 1.0%
0.2% sleep badly because of it (Amsterdam 0.8%, the Netherlands 0.5%) · RIVM estimate based on who lives here, not a count.
Serious noise annoyance from aircraft
Serious noise annoyance from aircraft
What is it?
The share of adults (18+) in this neighbourhood who are seriously annoyed by air traffic. In most neighbourhoods it is under 2%; the rank mainly sets apart the ones under a flight path. An estimate for the neighbourhood as a whole.
Why does it matter?
Aircraft noise stands out because it is irregular and often also sounds in the evening and at night.
- Original value
- 12.9%
- Higher than 95% of all Dutch neighbourhoods.
- Method
- RIVM model estimate (Gezondheidsmonitor 2024) for the adults (18+) in the buurt, derived from national surveys and characteristics of the residents.
- Source
- RIVM Gezondheidsmonitor (CBS 50150NED)Retrieved on 18 October 2026 · Licence: CC-BY 4.0More about this source
12.9%
- 5.3 pp
- higher than in Amsterdam
- 7.6%
- 9.5 pp
- higher than in the Netherlands
- 3.4%
5.2% sleep badly because of it (Amsterdam 3.9%, the Netherlands 1.5%) · RIVM estimate based on who lives here, not a count.
Serious noise annoyance from wind turbines
Serious noise annoyance from wind turbines
What is it?
The share of adults (18+) in this neighbourhood who are seriously annoyed by wind turbines. Around 0.5% almost everywhere, so without a score: it only rises right next to a wind farm. An estimate for the neighbourhood as a whole.
Why does it matter?
Wind turbines make noticeable noise only in their immediate vicinity.
- Original value
- 0.5%
- Method
- RIVM model estimate (Gezondheidsmonitor 2024) for the adults (18+) in the buurt, derived from national surveys and characteristics of the residents.
- Source
- RIVM Gezondheidsmonitor (CBS 50150NED)Retrieved on 18 October 2026 · Licence: CC-BY 4.0More about this source
0.5%
- 0.0 pp
- similar to Amsterdam
- 0.5%
- 0.1 pp
- similar to the Netherlands
- 0.6%
RIVM estimate based on who lives here, not a count.
Air quality: nitrogen dioxide (NO2)
Air quality: nitrogen dioxide (NO2)
16.6 µg/m³Clean air
What is it?
How much nitrogen dioxide (NO₂) there is in the outdoor air on average, over a whole year. NO₂ mainly comes from car and lorry exhausts, and from burning fuel in factories and boilers. Measured in micrograms per cubic metre of air (µg/m³). It is calculated with a model, not measured at this address.
Why does it matter?
NO₂ irritates the airways. Children and people with asthma or a lung condition are affected most.
Levels
- Very clean air< 10 µg/m³
- Clean air10–20 µg/m³Now
- Reduced air quality20–40 µg/m³
- Poor air quality≥ 40 µg/m³
Where do these limits come from? The WHO advises at most 10 µg/m³. The European limit is 40 µg/m³ today and becomes 20 µg/m³ from 2030.
- Method
- National concentration map 2024 (RIVM/CBS Grootschalige Concentratiekaarten Nederland, published 2026-04-01). A modelled annual average on a national, coarse-resolution grid — not an air-quality measurement at this exact address.
- Source
- RIVM/CBS Grootschalige Concentratiekaarten Nederland (GCN/NSL)Retrieved on 19 October 2026 · Licence: CC-BY 4.0More about this source
Clean air (16.6 µg/m³)
Air quality: particulate matter (PM10)
Air quality: particulate matter (PM10)
15.9 µg/m³Clean air
What is it?
How much particulate matter (PM10) there is in the outdoor air on average, over a whole year. These are dust particles smaller than 10 micrometres, from traffic, industry, farming and wood stoves, among others. Measured in micrograms per cubic metre of air (µg/m³). It is calculated with a model, not measured at this address.
Why does it matter?
You breathe particulate matter deep into your airways. Years of high exposure raise the risk of lung and heart problems.
Levels
- Very clean air< 15 µg/m³
- Clean air15–20 µg/m³Now
- Average air quality20–30 µg/m³
- Reduced air quality30–50 µg/m³
- Poor air quality≥ 50 µg/m³
Where do these limits come from? The WHO advises at most 15 µg/m³. The other limits (20, 30 and 50 µg/m³) are WHO interim targets. The European limit is 40 µg/m³ today.
- Method
- National concentration map 2024 (RIVM/CBS Grootschalige Concentratiekaarten Nederland, published 2026-04-01). A modelled annual average on a national, coarse-resolution grid — not an air-quality measurement at this exact address.
- Source
- RIVM/CBS Grootschalige Concentratiekaarten Nederland (GCN/NSL)Retrieved on 19 October 2026 · Licence: CC-BY 4.0More about this source
Clean air (15.9 µg/m³)
Air quality: particulate matter (PM2.5)
Air quality: particulate matter (PM2.5)
8.6 µg/m³Clean air
What is it?
How much fine particulate matter (PM2.5) there is in the outdoor air on average, over a whole year. These are the smallest dust particles, under 2.5 micrometres, mostly from burning (traffic, wood stoves, industry) and farming. Measured in micrograms per cubic metre of air (µg/m³). It is calculated with a model, not measured at this address.
Why does it matter?
These particles are so small they can pass through the lungs into your blood. Of all air pollution, PM2.5 has the largest effect on health.
Levels
- Very clean air< 5 µg/m³
- Clean air5–10 µg/m³Now
- Average air quality10–15 µg/m³
- Reduced air quality15–25 µg/m³
- Poor air quality≥ 25 µg/m³
Where do these limits come from? The WHO advises at most 5 µg/m³. The other limits (10, 15 and 25 µg/m³) are WHO interim targets. The European limit is 25 µg/m³ today and becomes 10 µg/m³ from 2030.
- Method
- National concentration map 2024 (RIVM/CBS Grootschalige Concentratiekaarten Nederland, published 2026-04-01). A modelled annual average on a national, coarse-resolution grid — not an air-quality measurement at this exact address.
- Source
- RIVM/CBS Grootschalige Concentratiekaarten Nederland (GCN/NSL)Retrieved on 19 October 2026 · Licence: CC-BY 4.0More about this source
Clean air (8.6 µg/m³)
Flood probability
Flood probability
Chance below 1 in 3,000 per year
What is it?
How likely it is, per year, that this spot ends up under water in a flood, for example when a dike breaks. It is a national estimate per area, not a prediction that it will happen here soon.
Why does it matter?
A flood can cause major damage to your home and belongings. Most Dutch buildings insurance policies do not cover damage from a dike breach.
Levels
- Does not flood
- Chance below 1 in 3,000 per yearNow
- Chance of 1 in 300 to 1 in 3,000 per year
- Chance of 1 in 30 to 1 in 300 per year
- Chance above 1 in 30 per year
Where do these limits come from? The levels are the official classes of the location-specific flood probability in the Klimaateffectatlas: the yearly chance of water standing at this spot in a flood.
- Source
- Klimaateffectatlas (plaatsgebonden overstromingskans, huidig klimaat)Retrieved on 19 October 2026 · Licence: CC-BY 4.0More about this source
Chance below 1 in 3,000 per year
Cooling down indoors in hot weather
Cooling down indoors in hot weather
What is it?
The share of adults (18+) in this neighbourhood who can cool down well indoors in hot weather. This is how residents experience it, next to the calculated heat stress above. An estimate for the neighbourhood as a whole.
Why does it matter?
A home that stays warm in summer makes sleeping and resting hard.
- Original value
- 54.5%
- Higher than 24.5% of all Dutch neighbourhoods.
- Method
- RIVM model estimate (Gezondheidsmonitor 2024) for the adults (18+) in the buurt, derived from national surveys and characteristics of the residents.
- Source
- RIVM Gezondheidsmonitor (CBS 50150NED)Retrieved on 18 October 2026 · Licence: CC-BY 4.0More about this source
54.5%
- 13.3 pp
- higher than in Amsterdam
- 41.2%
- 2.8 pp
- lower than in the Netherlands
- 57.3%
RIVM estimate based on who lives here, not a count.
Cooling down outdoors in hot weather
Cooling down outdoors in hot weather
What is it?
The share of adults (18+) in this neighbourhood who can cool down well outdoors in hot weather, for instance in shade or near water. An estimate for the neighbourhood as a whole.
Why does it matter?
Shade and water nearby make hot days outdoors easier to bear.
- Original value
- 62.5%
- Higher than 46.8% of all Dutch neighbourhoods.
- Method
- RIVM model estimate (Gezondheidsmonitor 2024) for the adults (18+) in the buurt, derived from national surveys and characteristics of the residents.
- Source
- RIVM Gezondheidsmonitor (CBS 50150NED)Retrieved on 18 October 2026 · Licence: CC-BY 4.0More about this source
62.5%
- 19.7 pp
- higher than in Amsterdam
- 42.8%
- 6.1 pp
- higher than in the Netherlands
- 56.4%
RIVM estimate based on who lives here, not a count.
Land subsidence
Land subsidence
−2.2 mm/yearLimited subsidence
What is it?
How many millimetres the ground here sinks or rises per year. A minus means the ground is sinking. It is an average over a square of about 50 by 50 metres, not a measurement of this home's foundation.
Why does it matter?
Sinking ground can cause cracks in walls, sticking doors, and subsiding gardens, paths and pipes. The greatest risk is to an older home without piles or on wooden piles, in an area with peat or clay. It is mainly uneven sinking that damages a house; this map shows the pace in the area, not how evenly it happens.
Levels
- Ground rising> 1.5 mm/year
- Little to no ground movement−1.5 to 1.5 mm/year
- Limited subsidence−5 to −1.5 mm/yearNow
- Strong subsidence−10 to −5 mm/year
- Very strong subsidence≤ −10 mm/year
Where do these limits come from? The levels are the classes of the Klimaateffectatlas's national subsidence map. Rising ground is uncommon and not good or bad in itself.
- Method
- Klimaateffectatlas, national subsidence map (published 2026-06-23), approximately 50 m grid cell — not a measurement of this dwelling's foundation specifically.
- Source
- Klimaateffectatlas (bodemdaling, landelijke meting/model)Retrieved on 19 October 2026 · Licence: CC-BY 4.0More about this source
Limited subsidence (−2.2 mm/year)
Wooden pile foundation attention point
Wooden pile foundation attention point
Signals, based on build year and a national indicative postcode-area soil map, whether a wooden pile foundation and possible pile rot are worth having investigated. This is NOT a statement about this dwelling's actual foundation condition.
- Original value
- Built in 2010: no known point of attention from this signal — wooden pile foundations were no longer standard practice by this construction period.
- Method
- Wooden pile foundations were standard practice until roughly 1970 in settlement-sensitive soil regions; concrete piling became standard from 1970 onward (KCAF). This signals only the build year, not this dwelling's actual foundation.
- Source
- RVO/KCAF Indicatieve Aandachtsgebieden Funderingsproblematiek + BAG bouwjaarRetrieved on 19 October 2026 · Licence: CC0More about this source
Built in 2010: no known point of attention from this signal — wooden pile foundations were no longer standard practice by this construction period.
Building plans
What is being built nearby.
Building work nearby
- 8 rental and hospitality
- 10 undescribed
Open the map below to see where each one is. It opens in a pop-up window.
The 18 notices within 500 m of this address come from officielebekendmakingen.nl (KOOP) and are the same ones summarised in the 'recent notices' row above. For 10 of them the municipality publishes only the permit type and the address, not what is being done.
Source: Rijksoverheid: Officiele bekendmakingen (repository.overheid.nl/sru)
Sources
Where this report comes from.
- WOZ-waardeloket (Kadaster LV-WOZ)
- BAG (Basisregistratie Adressen en Gebouwen)
- HuisWeter-bouwjaar-checklist (Milieu Centraal, RIVM, Instituut Asbestslachtoffers, vakliteratuur bouwkundige keuring)
- CBS 86165NED (WOZ-waarden), 83625NED (verkoopprijzen woningen), 85773NED (prijsindex bestaande koopwoningen)
- HuisWeter-model: robuuste effectgrootte op WOZ-jaargroei (CBS 86165NED)
- HuisWeter-model: gemeentelijke OZB-opbrengst (CBS 83642NED) x WOZ-waarde
- HuisWeter-model: gemeentelijke rioolheffing-opbrengst (CBS 83642NED)
- HuisWeter-model: gemeentelijke afvalstoffenheffing-opbrengst (CBS 83642NED)
- HuisWeter-model: landelijk gemiddelde waterschapstarieven (CBS 80892NED)
- CBS 81528NED (energieverbruik per woningtype en gemeente) x landelijke energietarieven (CBS 85592NED)
- HuisWeter-model: onderhoudsreserve (0,85%/jaar van aangenomen herbouwwaarde)
- HuisWeter-model: opstalverzekering (percentage van aangenomen herbouwwaarde)
- HuisWeter-model: som van de woninggebonden maandlasten
- CBS Kerncijfers wijken en buurten (KWB) 2025
- RIVM Gezondheidsmonitor (CBS 50150NED)
- CBS/Politie: Geregistreerde misdrijven; soort misdrijf, wijk, buurt (47018NED)
- OpenStreetMap contributors (via Overpass API)
- DUO Open Onderwijsdata
- Landelijk Register Kinderopvang (DUO / SZW)
- RIVM Atlas Leefomgeving
- RIVM/CBS Grootschalige Concentratiekaarten Nederland (GCN/NSL)
- Klimaateffectatlas (plaatsgebonden overstromingskans, huidig klimaat)
- Klimaateffectatlas (bodemdaling, landelijke meting/model)
- RVO/KCAF Indicatieve Aandachtsgebieden Funderingsproblematiek + BAG bouwjaar
- Funda
- PDOK Locatieserver (adrescoordinaten)
- CBS Kerncijfers wijken en buurten (KWB), edities 2023-2026
- Rijksoverheid: Officiele bekendmakingen (repository.overheid.nl/sru)
- NVM — Woningmarktcijfers per COROP-regio