Price and WOZ value
The official WOZ value per reference date, plus an estimated market value with a range. Is the asking price inside or outside that range? An estimate, not a valuation.
Type an address and read one clear report: WOZ value, estimated market value, monthly costs, schools, amenities, neighbourhood figures and risks. All from public sources, with the method alongside.
One report per address, built from six parts. Every figure shows its source and its method.
The official WOZ value per reference date, plus an estimated market value with a range. Is the asking price inside or outside that range? An estimate, not a valuation.
Property tax, sewer charge, waste charge, water board tax, maintenance and buildings insurance added up, as an estimate. Excluding mortgage and energy.
The distance from this address to the nearest supermarket, GP, school and daycare, plus a map of everything within 3 km.
Primary and secondary schools on the map, with distance and, where DUO publishes them, results. Schools are only compared with comparable schools.
The registered energy label, noise, air quality, flood probability, subsidence and foundation points of attention for the location.
Inhabitants, ages, households, income and the number of recorded offences per 1,000 inhabitants. Figures about the neighbourhood, never about a street or a person.
A neighbourhood average says little about your street. HuisWeter measures the distance from the address itself to the nearest supermarket, GP, school and daycare, even when it is more than a kilometre away.
Distances measured as the crow flies, not a walking route. Scale 0 to 1 km.
Eight things HuisWeter does differently from an ordinary property site.
All property-related costs added up to an estimated monthly amount, compared with the rest of the Netherlands.
Our estimate with its range beside the home's asking price, so you see whether it falls inside.
Measured from the address itself, not an average across the neighbourhood.
Final tests and exams are compared with schools that sit the same test, not across all schools.
Public notices of building permits within 500 m, where the municipality publishes them. An empty list does not always mean nothing is happening.
Sale price per m² and time to sell for the NVM region, with the period. Regional figures, not per municipality.
Each figure is placed next to those of all other neighbourhoods or addresses in the Netherlands. The overall score is an average, not a percentile.
For each figure you see the source behind it, how it was calculated and how sure we are of it.
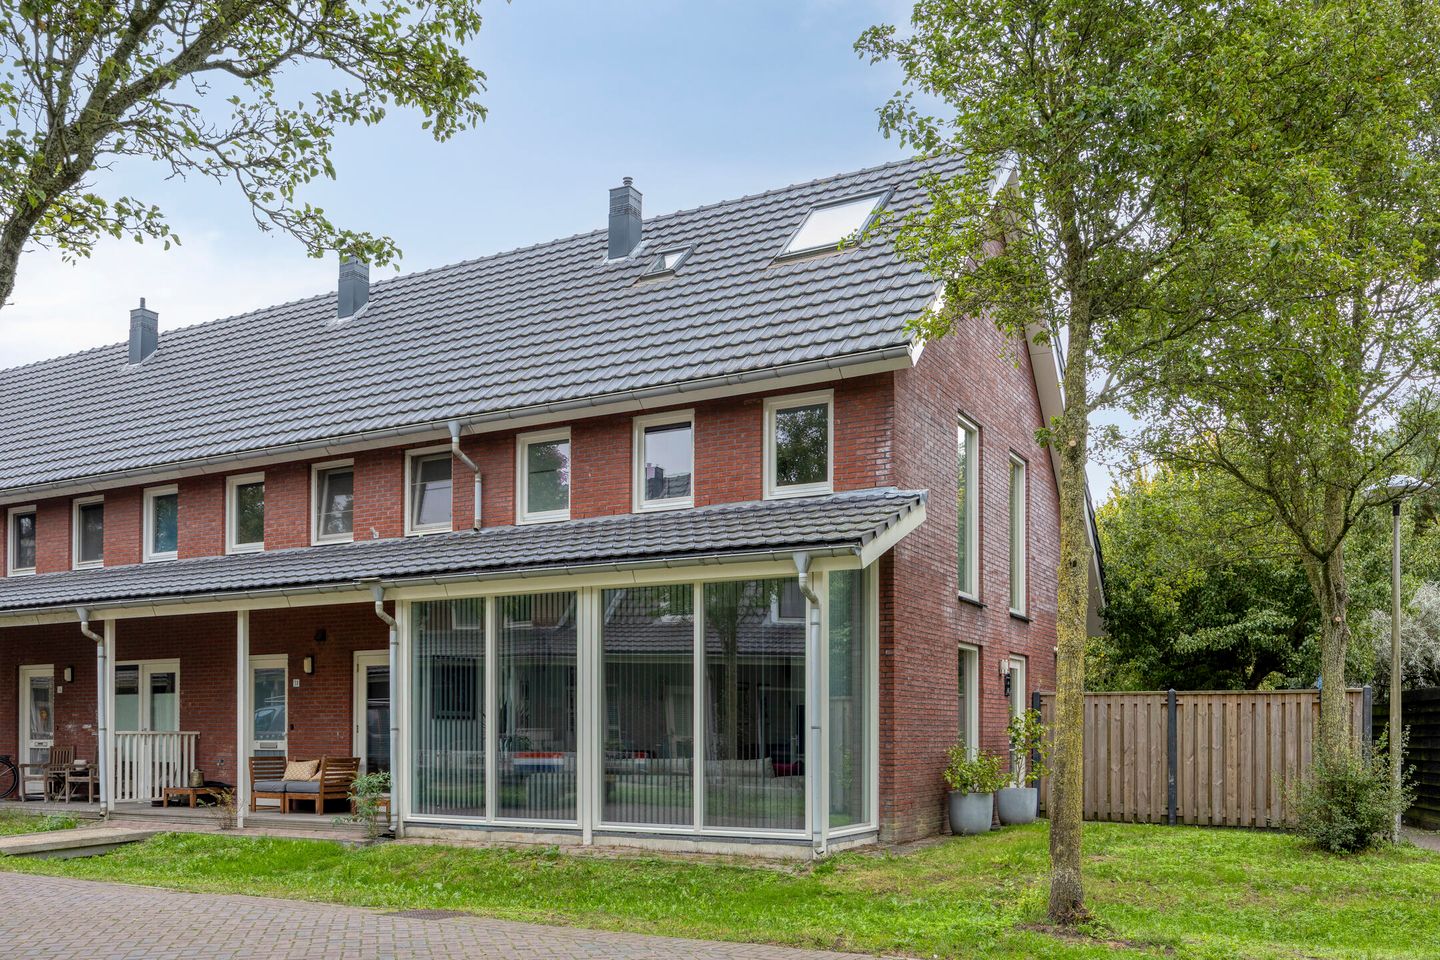
3452EP Vleuten · Vleuterweide-Zuid
House · 108 m² · 4 rooms · built 2004
Overall score: average of the sections on a scale of 0 to 100, not a percentile. Report of October 18, 2026; asking price according to Funda.
A real address that is for sale right now, with the figures from the report itself. Open the full report to see every section.
Start with a street and house number or a postcode. We find the address in the BAG, the official address register.
Kadaster, CBS, DUO, RIVM, RVO and more are linked to the address and converted into comparable figures.
Read the report, open the explanation behind each figure and put two addresses side by side.
Average WOZ value, homes for sale, neighbourhood figures and trends per municipality, district and neighbourhood.

Photo: C messier, CC BY-SA 4.0, Wikimedia Commons

Photo: Massimo Catarinella, CC BY 3.0, Wikimedia Commons

Photo: Fryslan0109 at English Wikipedia, Public domain, Wikimedia Commons

Photo: W. Bulach, CC BY-SA 4.0, Wikimedia Commons

Photo: W. Bulach, CC BY-SA 4.0, Wikimedia Commons

Photo: W. Bulach, CC BY-SA 4.0, Wikimedia Commons

Photo: Nummer 12, CC BY-SA 3.0, Wikimedia Commons

Photo: C messier, CC BY-SA 4.0, Wikimedia Commons
No data of our own, no assumptions out of thin air. Everything comes from government bodies and open databases and can be checked.
Look up the address on HuisWeter and you see the WOZ value per reference date, including its development over the years. The value comes from the Kadaster's WOZ-waardeloket. The WOZ value is not a market value: the municipality sets it for tax purposes. That is why we show an estimated market value next to it.
HuisWeter estimates the property-related monthly costs: property tax (OZB), sewer charge, waste charge, water board tax, maintenance and buildings insurance. A mortgage and energy costs are not included. It is a model with assumptions, so an explanation comes with it.
Yes. You do not need an account and you pay nothing. We do not keep a record of which addresses you look up.
From public sources, including CBS, Kadaster and BAG, PDOK, RVO (energy labels), DUO (schools), the national childcare register, OpenStreetMap, NVM, the police via CBS, RIVM and Rijkswaterstaat. Every figure shows its source. The overview is on the Sources page.
That differs per source. CBS neighbourhood figures are renewed yearly, the WOZ value follows the latest reference date, amenities follow the latest OpenStreetMap extract. Each source shows its own reference date and the Sources page shows when it was last refreshed.
It is a statistical estimate based on the WOZ value and CBS figures, not a valuation. That is why you see a range and not a single amount. Condition, renovations and interior are not in public sources and so not in the estimate.
The overall score is the average of the sections for which enough data exists, on a scale of 0 to 100. It is not a percentile and not a grade for the home itself. Look at the sections: what matters most to you is your call.
The report shows primary and secondary schools within 3 km on the map, with the distance from the address. Where DUO publishes results you also see final-test and exam figures, compared with schools in the same group.
Nothing about a street or a person. We show the number of recorded offences per 1,000 inhabitants for the whole neighbourhood, next to all other neighbourhoods in the Netherlands. They are facts about an area.
Then the report says it is missing and why, for example because a source does not publish it. We fill nothing in and do not guess. A section with too little data does not count towards the overall score.
Free, no account, sources included.