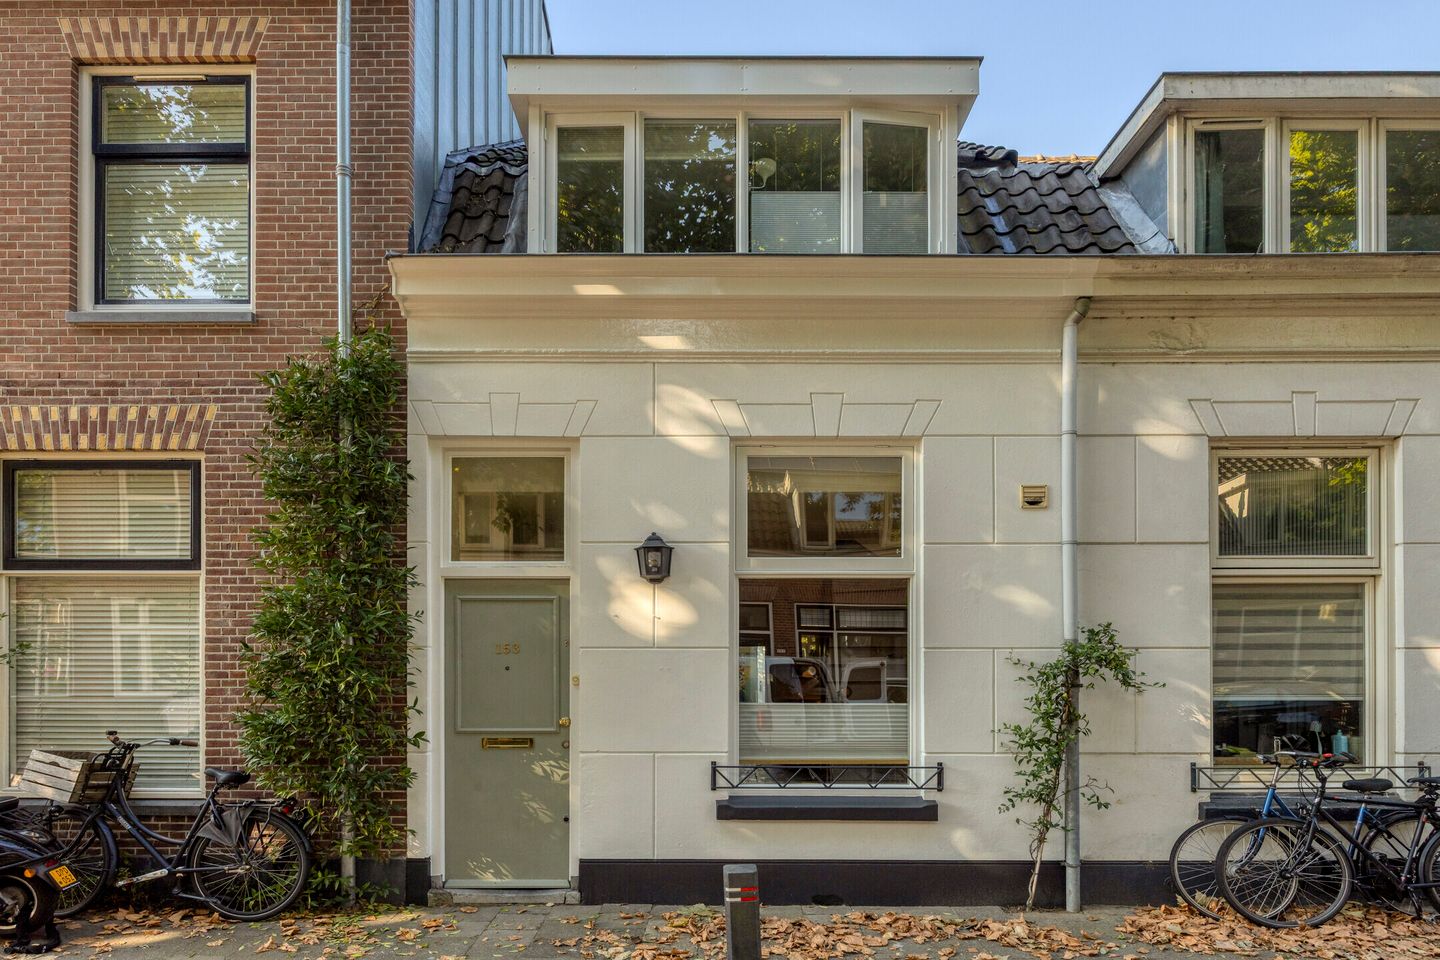
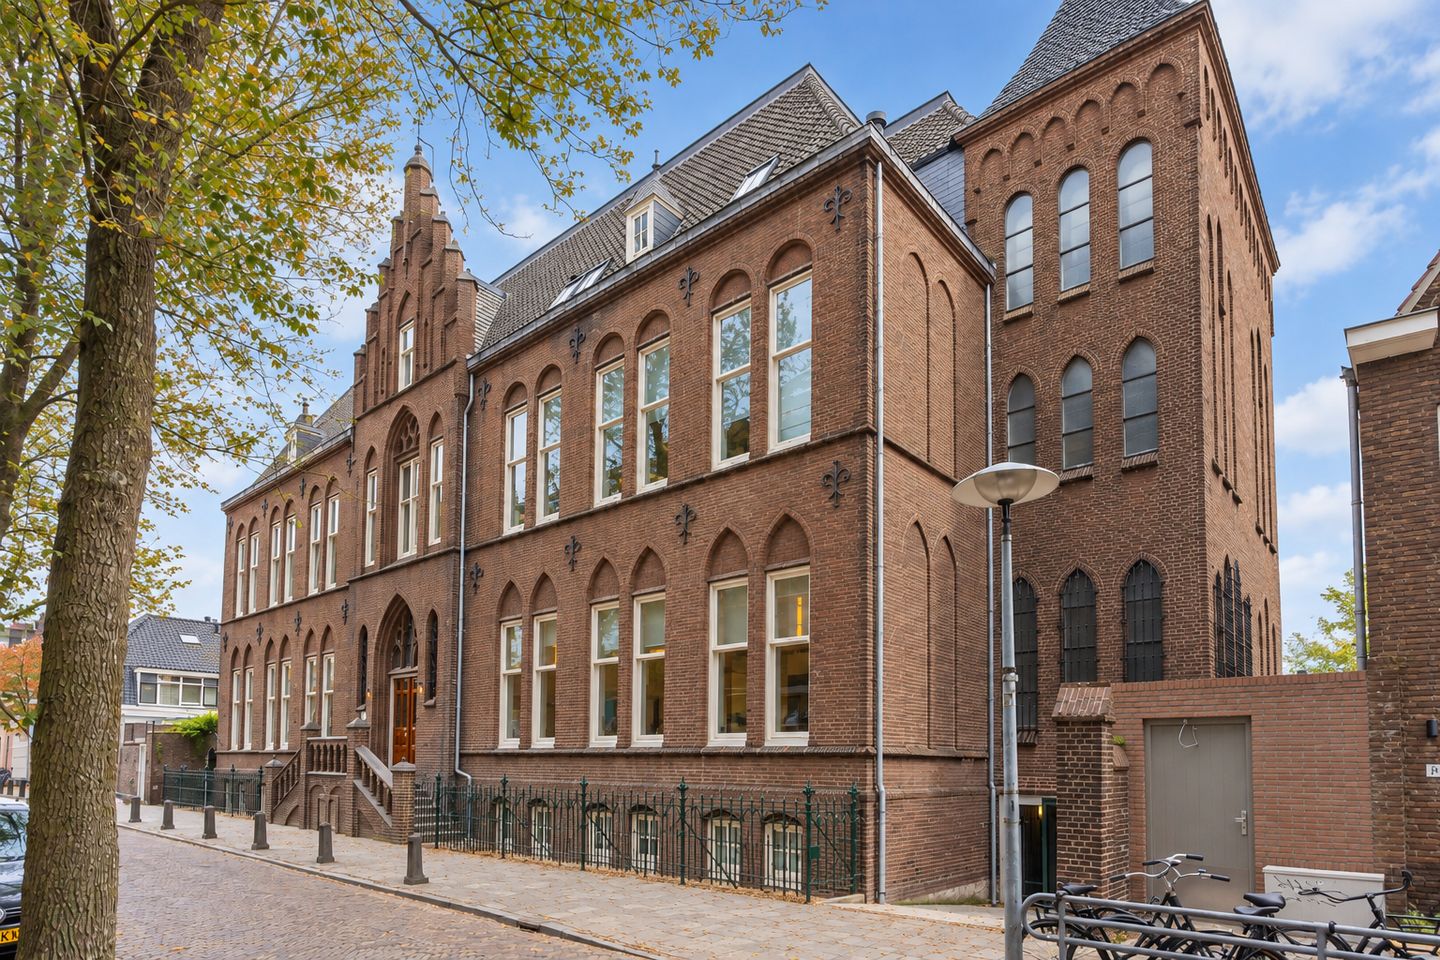
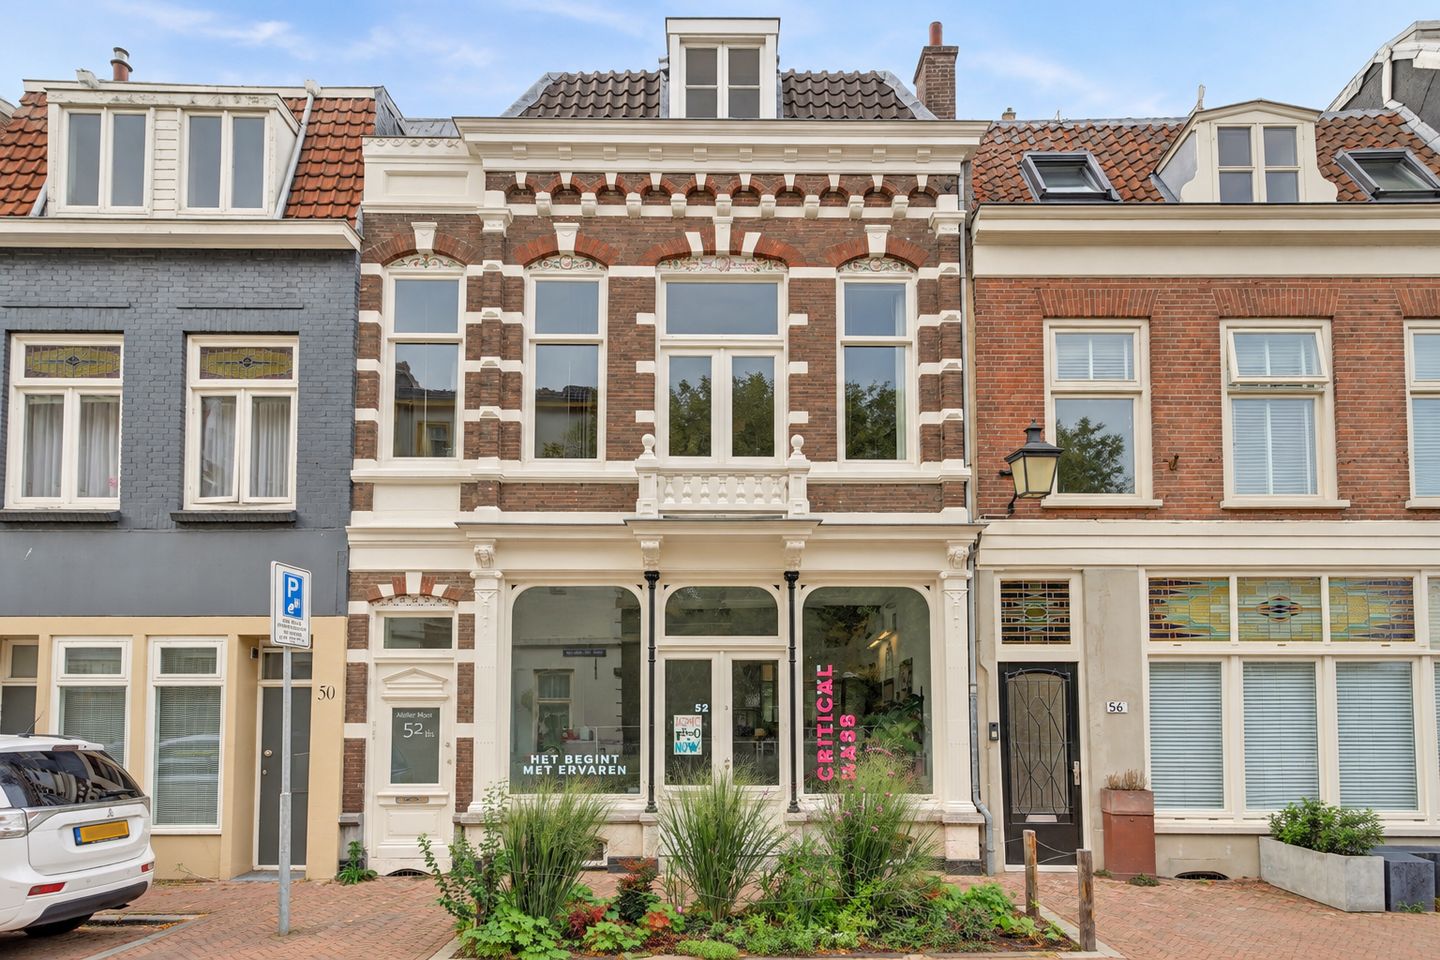
The average WOZ value in Utrecht is €480,000, 21% higher than in the Netherlands (€398,000). Between 2019 and 2025 the average WOZ value rose 59%, the same as in the Netherlands. 58% of the homes are owner-occupied, 1 percentage point more than in the Netherlands (57%). 1,035 homes are currently for sale, with asking prices from €177,500 to €4,700,000.
Key figures
Average WOZ value
€480,000
▲21% higher than the Netherlands (€398,000)
Rise in WOZ value since 2019
+59%
=about the same as the Netherlands (+59%)
More figures
Owner-occupied dwellings
58%
▲1 percentage point higher than the Netherlands (57%)
Social housing
27%
▼1 percentage point lower than the Netherlands (28%)
Private rent
15%
▲1 percentage point higher than the Netherlands (14%)
Single-family dwellings
61%
▼2 percentage points lower than the Netherlands (63%)
WOZ value per year
The average WOZ value rose 59% between 2019 and 2025, to €480,000.
Average WOZ value, 2025
€480,000▲ 21% above the Netherlands
+59% since 2019
Netherlands +59%
Explanation
The WOZ value as struck on 1 January of the year before the KWB edition.
Source: CBS Kerncijfers wijken en buurten (KWB) 2025
Asking prices
For the 1033 homes for sale here the median asking price is €6,200 per m²; the middle half ask €5,172 to €7,194 per m².
Value
Homes for sale (with asking price and floor area)
1033
Median asking price per m²
€6,200
Middle half
€5,172 – €7,194
Explanation
Asking prices of homes currently listed on Funda, not the prices homes sell for. Only homes HuisWeter has collected; the middle half runs from the first to the third quartile.
Source: Funda
Dwellings by ownership
The largest category is owner-occupied, at 58% of dwellings.
Owner-occupied58%
Social housing27%
Private rent15%
Explanation
CBS publishes this as a share of the dwelling stock, not a count.
Source: CBS Kerncijfers wijken en buurten (KWB) 2025
Dwellings by type
61% of the dwelling stock is single-family homes.
Single-family homes61%
Multi-family homes39%
Explanation
CBS publishes this as a share of the dwelling stock, not a count.
Source: CBS Kerncijfers wijken en buurten (KWB) 2025
02 · For sale
1,035 homes for sale now
Asking prices from €177,500 to €4,700,000; median €6,200 per m². Asking prices, not sale prices.
Every municipality at the same reference year per measure. The lines mark the province's figure (summed from its municipalities; WOZ and owner-occupation weighted by dwelling count) and the Netherlands'. Growth is missing where a municipality merged or gained territory in those years.
Source: CBS key figures for districts and neighbourhoods; CBS/Police registered crime 2026
04 · Safety
Less registered crime per resident than the Dutch average.
In 2025, 44 crimes per 1,000 residents were registered in Utrecht, 2% lower than in the Netherlands (45). Since 2021 the registered rate per 1,000 residents rose 8%, against a rise of 5% in the Netherlands. Crimes are counted where they happen, not where the offender lives.
Key figures
Crimes per 1,000 residents, 2025
44
▼2% lower than the Netherlands (45)
Change since 2021
+8%
▲higher than the Netherlands (+5%)
Home burglary per 1,000 dwellings
3.1
▲15% higher than the Netherlands (2.7)
Crimes per 1,000 residents, 2025
44
▼2% lower than the Netherlands (45)
Change since 2021
+8%
▲higher than the Netherlands (+5%)
Home burglary per 1,000 dwellings
3.1
▲15% higher than the Netherlands (2.7)
Registered crimes per 1,000 residents, 2025
In 2025, Utrecht province registered 44 crimes per 1,000 residents, against 45 in the Netherlands.
Utrecht province44
The Netherlands45
Explanation
Crime is counted where it happens and divided by the number of residents, so places with many visitors — city centres, nightlife, stations — score higher.
The largest category in Utrecht province is 'Theft and burglary': 22.7 per 1,000 residents in 2025, against 19.8 in the Netherlands.
Utrecht provinceThe Netherlands
Theft and burglary22.7
NL 19.8▲ +15% vs NL
Traffic7.0
NL 7.6▼ −8% vs NL
Vandalism and public order4.8
NL 5.1▼ −6% vs NL
Fraud and scams4.4
NL 5.1▼ −14% vs NL
Violence and threats3.8
NL 4.8▼ −21% vs NL
Other and withheld1.7
NL 2.1▼ −19% vs NL
Environmental0.2
NL 0.2≈ NL
Explanation
Four categories are structurally withheld at buurt level (sex offences, child pornography, child prostitution, other integrity offences); the gap with the published total is shown under 'other'.
Agricultural land is the largest land use in Utrecht, covering 56% of the area, against 52% in the Netherlands. Green space such as parks, sports fields, forest and nature covers 19% of the area, 3 percentage points above the 16% in the Netherlands.
Key figures
Green (parks, sport, nature)
19%
▲3 percentage points higher than the Netherlands (16%)
Water, share of the area
5%
▼14 percentage points lower than the Netherlands (19%)
Built-up, share of the area
16%
▲7 percentage points higher than the Netherlands (9%)
Agriculture, share of the area
56%
▲4 percentage points higher than the Netherlands (52%)
Land use
19% of the area is green (parks, sport, nature), against 16% in the Netherlands.
Traffic3.4%
Built-up16.1%
Other built-up0.7%
Recreation4.4%
Agriculture55.6%
Forest and nature15%
Water4.8%
Explanation
Every share is calculated as a percentage of the TOTAL area (land and water together, peiljaar 2022); water is therefore one of the slices itself, not a separate whole. Green is the sum of recreational terrain (parks, sport fields, allotments, day recreation) and natural terrain (forest, open natural terrain) — agricultural land is not counted as green here.
Source: CBS Bodemgebruik (86211NED) 2022
06 · Residents
The population is growing about as fast as the Dutch average.
Utrecht has 1,415,104 inhabitants (2026), or 953 per km² (77% higher than in the Netherlands). Between 2019 and 2026 the population rose 5%, the same as in the Netherlands.
Key figures
Population growth since 2019
+5%
=about the same as the Netherlands (+5%)
Growth of the dwelling stock
+7%
▲higher than the Netherlands (+6%)
Population growth since 2019
+5%
=about the same as the Netherlands (+5%)
Growth of the dwelling stock
+7%
▲higher than the Netherlands (+6%)
Population per year
The population grew 5% between 2019 and 2026, to 1,415,104.
Residents, 2026
1,415,104
+5% since 2019
Netherlands +5%
Source: CBS Kerncijfers wijken en buurten (KWB) 2026
Density
With 953 residents per km², this province is 77% more densely populated than the Netherlands.
Residents per km²953
Dwellings per km²417.5
Source: CBS Kerncijfers wijken en buurten (KWB) 2026
Births and deaths per 1,000 residents
In 2025, 10.3 children were born per 1,000 residents; 8.3 died per 1,000.
2019
2020
2021
2022
2023
2024
2025
BirthsDeaths
Source: CBS Kerncijfers wijken en buurten (KWB) 2025
07 · More figures
More figures
Utrecht has an average of 1.2 cars per household, 9% higher than in the Netherlands (1.1). 32% of cars run on something other than petrol (diesel, LPG or electricity, hybrids included), 6 percentage points more than in the Netherlands (26%).
Key figures
Business services, share of businesses
30%
▲5 percentage points higher than the Netherlands (25%)
Industry and energy, share of businesses
11%
▼3 percentage points lower than the Netherlands (14%)
Trade and hospitality, share of businesses
14%
▼2 percentage points lower than the Netherlands (16%)
Cars per household (2025)
1.2
▲9% higher than the Netherlands (1.1)
Cars not on petrol (2025)
32%
▲6 percentage points higher than the Netherlands (26%)
Change in cars not on petrol since 2019
+7 pp
▲higher than the Netherlands (+6 pp)
Average WOZ value
€480,000
▲21% higher than the Netherlands (€398,000)
Private rent
15%
▲1 percentage point higher than the Netherlands (14%)
Multi-family dwellings
39%
▲2 percentage points higher than the Netherlands (37%)
Business establishments by sector
Zakelijke dienstverlening is the largest sector, with 64,395 establishments.
Landbouw, bosbouw en visserij3,340
Nijverheid en energie23,755
Handel en horeca30,605
Vervoer, informatie en communicatie19,730
Financiële diensten, onroerend goed10,950
Zakelijke dienstverlening64,395
Overheid, onderwijs en zorg42,045
Cultuur, recreatie, overige diensten23,120
Source: CBS Kerncijfers wijken en buurten (KWB) 2025
Passenger cars by fuel type
32% of passenger cars do not run on petrol (diesel, LPG, electric etc.), against 26% in the Netherlands (2025).
Petrol67.9%
Other fuel (diesel, LPG, electric etc.)32.1%
Explanation
CBS splits passenger cars into 'petrol' and 'other fuel' only. That second category bundles diesel, LPG, electric (including hybrid), hydrogen, alcohol, LNG and CNG together — CBS publishes no separate electric-car count per buurt, wijk or gemeente, so this is not the same as an 'electric share'.
Source: CBS Kerncijfers wijken en buurten (KWB) 2025
Share on other fuel per year
The share of passenger cars not running on petrol went from 25% to 32% between 2019 and 2025.
Share on other fuel, 2025
32%▲ 6 percentage points above the Netherlands (26%)
+7 pp since 2019
Netherlands +6 pp
Explanation
See the 'Passenger cars by fuel type' card for what 'other fuel' covers — this is not the share of electric cars.
Source: CBS Kerncijfers wijken en buurten (KWB) 2025
Vehicles by kind
In 2025, 789,680 passenger cars and 48,515 motorcycles were registered here.
Passenger cars789,680
Motorcycles48,515
Explanation
At this level CBS publishes only passenger cars and motorcycles, no vans or trucks.
Source: CBS Kerncijfers wijken en buurten (KWB) 2025
Biggest difference from the Netherlands
953 residents per km²: 77% more densely populated than the Dutch average.
This areaThe Netherlands
Residents per km²953
NL 539▲ +77% vs NL
Average WOZ value€480,000
NL €398,000▲ +21% vs NL
Private rent15%
NL 14%▲ +7% vs NL
Multi-family dwellings39%
NL 37%▲ +5% vs NL
Social housing27%
NL 28%≈ NL
Explanation
The 5 characteristics that differ most from the national average, ranked by log ratio (so a halving and a doubling count as equally different); the shown percentage is the ordinary difference against the Netherlands.
Source: CBS Kerncijfers wijken en buurten (KWB) 2026