We're pulling the figures from public sources. This usually takes a few seconds.
Area and its neighbourhoodsCBS key figures for districts and neighbourhoods
Residents and householdsCBS
Homes and WOZ valueCBS · Kadaster BAG
Housing marketNVM market overview
Municipal leviesMunicipal budgets · CBS
SafetyCBS and Police
HealthRIVM Health Monitor
Land use and amenitiesCBS land use · proximity statistics
Road safety and electionsRijkswaterstaat · Kiesraad
Comparing with the municipality and the countryRankings and comparisons
Living in Indische Buurt-West (Amsterdam): WOZ, prices & areas
District · Amsterdam
Living in Indische Buurt-West
The population is shrinking, while it grows in Amsterdam. Homes cost less than the average in the municipality of Amsterdam, and registered crime per resident is lower.
The average WOZ value in Indische Buurt-West is €474,000, 8% lower than in Amsterdam (€518,000). Between 2023 and 2025 the average WOZ value stayed about level, the same as in Amsterdam. 30% of the homes are owner-occupied, 1 percentage point less than in Amsterdam (31%). 50 homes are currently for sale, with asking prices from €315,000 to €895,000.
Key figures
Average WOZ value
€474,000
▼8% lower than Amsterdam (€518,000)
Rise in WOZ value since 2023
-0%
=about the same as Amsterdam (+0%)
More figures
Owner-occupied dwellings
30%
▼1 percentage point lower than Amsterdam (31%)
Social housing
53%
▲14 percentage points higher than Amsterdam (39%)
Private rent
17%
▼13 percentage points lower than Amsterdam (30%)
Single-family dwellings
0%
▼12 percentage points lower than Amsterdam (12%)
Built 1975–1991
30%
▲15 percentage points higher than Amsterdam (15%)
Built 2016 and later
4%
▼8 percentage points lower than Amsterdam (12%)
Built 1965–1974
0%
▼6 percentage points lower than Amsterdam (6%)
WOZ value per year
The average WOZ value held steady between 2023 and 2025, at €474,000.
Average WOZ value, 2025
€474,000▼ 8% below Amsterdam
+0% since 2023
Amsterdam +0%
Explanation
The WOZ value as struck on 1 January of the year before the KWB edition.
Source: CBS Kerncijfers wijken en buurten (KWB) 2025
Modelled ownership costs
Modelled ownership costs for a typical dwelling here: ~€226 per month (excluding mortgage and energy)
€226/ month
Typical home here, before mortgage and energy
77 m² · estimated gemeente average
WOZ €474,000 · average here
Levies you'll be billed€121NL median
Water board levy€45–
Waste levy€33€27
Property tax (OZB)€24€42
Sewage levy€19€22
Costs to set aside€105
Maintenance reserve€98–
Buildings insurance€7–
Model estimates, not bills.
For this home, Amsterdam's OZB, sewage and waste levies rank 26th of 334 gemeenten, cheapest first.
cheapestdearest
Water board, maintenance and insurance are estimated from national rates and the home's value and size, so they aren't compared.
Explanation
The home: one typical home of 77 m² (estimated gemeente average) with the average WOZ value here, €474,000.
Levies: Amsterdam's own OZB, sewage and waste rates for 2026. The water board levy uses national average rates.
Set aside: maintenance at 0.85% and buildings insurance at 0.06% a year of the rebuild cost (€1,800 per m²).
NL median: what the same home would pay in the middle gemeente. Gemeenten where a regional body collects the waste levy are left out.
Not included: mortgage and energy. These are estimates, not actual bills.
Source: Municipal levies + CBS 2026
Dwelling value ladder
Indische Buurt-West has the 46th-lowest WOZ value of the 108 wijken in the municipality of Amsterdam.
Average WOZ value from the Netherlands down to this area, and its rank within its own group (e.g. buurten within the same wijk). Provincie is omitted: KWB publishes no province rows to average.
Source: CBS Kerncijfers wijken en buurten (KWB)
WOZ value and age structure
Here: €474,000 average WOZ value.
Value
Dwellings
Aged 65+
Indische Buurt-West
474,000
6,712
–
Haarlemmerbuurt
601,000
5,700
–
Jordaan
556,000
13,425
–
Grachtengordel-West
892,000
4,394
–
Burgwallen-Nieuwe Zijde
524,000
3,080
–
Burgwallen-Oude Zijde
526,000
3,029
–
Nieuwmarkt/Lastage
597,000
6,369
–
Grachtengordel-Zuid
908,000
3,635
–
De Weteringschans
708,000
4,816
–
Weesperbuurt/Plantage
650,000
4,705
–
Oostelijke Eilanden/Kadijken
539,000
8,016
–
Sloterdijk-West
546,000
886
–
Spaarndammerbuurt/Zeeheldenbuurt
464,000
6,245
–
Houthavens
857,000
2,657
–
De Kolenkit
419,000
6,095
–
Landlust
435,000
9,849
–
Erasmuspark
454,000
3,117
–
Centrale Markt
573,000
1,244
–
Staatsliedenbuurt
470,000
8,043
–
Frederik Hendrikbuurt
485,000
5,192
–
Van Galenbuurt
431,000
3,233
–
Geuzenbuurt
501,000
3,777
–
Hoofdweg e.o.
447,000
5,817
–
Chassébuurt
536,000
3,005
–
Bellamybuurt
528,000
3,900
–
Da Costabuurt
581,000
2,770
–
Westindische Buurt
534,000
3,687
–
Van Lennepbuurt
478,000
4,423
–
Overtoomse Sluis
587,000
4,669
–
Explanation
Each circle is an area: position by average WOZ value, size by dwelling count. The 65-and-over share (pct_65_plus) travels on every point but is not yet drawn as a second axis.
Source: CBS Kerncijfers wijken en buurten (KWB)
Asking prices
For the 50 homes for sale here the median asking price is €8,333 per m²; the middle half ask €7,730 to €8,948 per m².
Value
Homes for sale (with asking price and floor area)
50
Median asking price per m²
€8,333
Middle half
€7,730 – €8,948
Explanation
Asking prices of homes currently listed on Funda, not the prices homes sell for. Only homes HuisWeter has collected; the middle half runs from the first to the third quartile.
Source: Funda
Dwellings by ownership
The largest category is social housing, at 53% of dwellings.
Owner-occupied30%
Social housing53%
Private rent17%
Explanation
CBS publishes this as a share of the dwelling stock, not a count.
Source: CBS Kerncijfers wijken en buurten (KWB) 2025
Dwellings by type
100% of the dwelling stock is multi-family homes.
Multi-family homes100%
Explanation
CBS publishes this as a share of the dwelling stock, not a count.
Source: CBS Kerncijfers wijken en buurten (KWB) 2025
Dwellings by build period
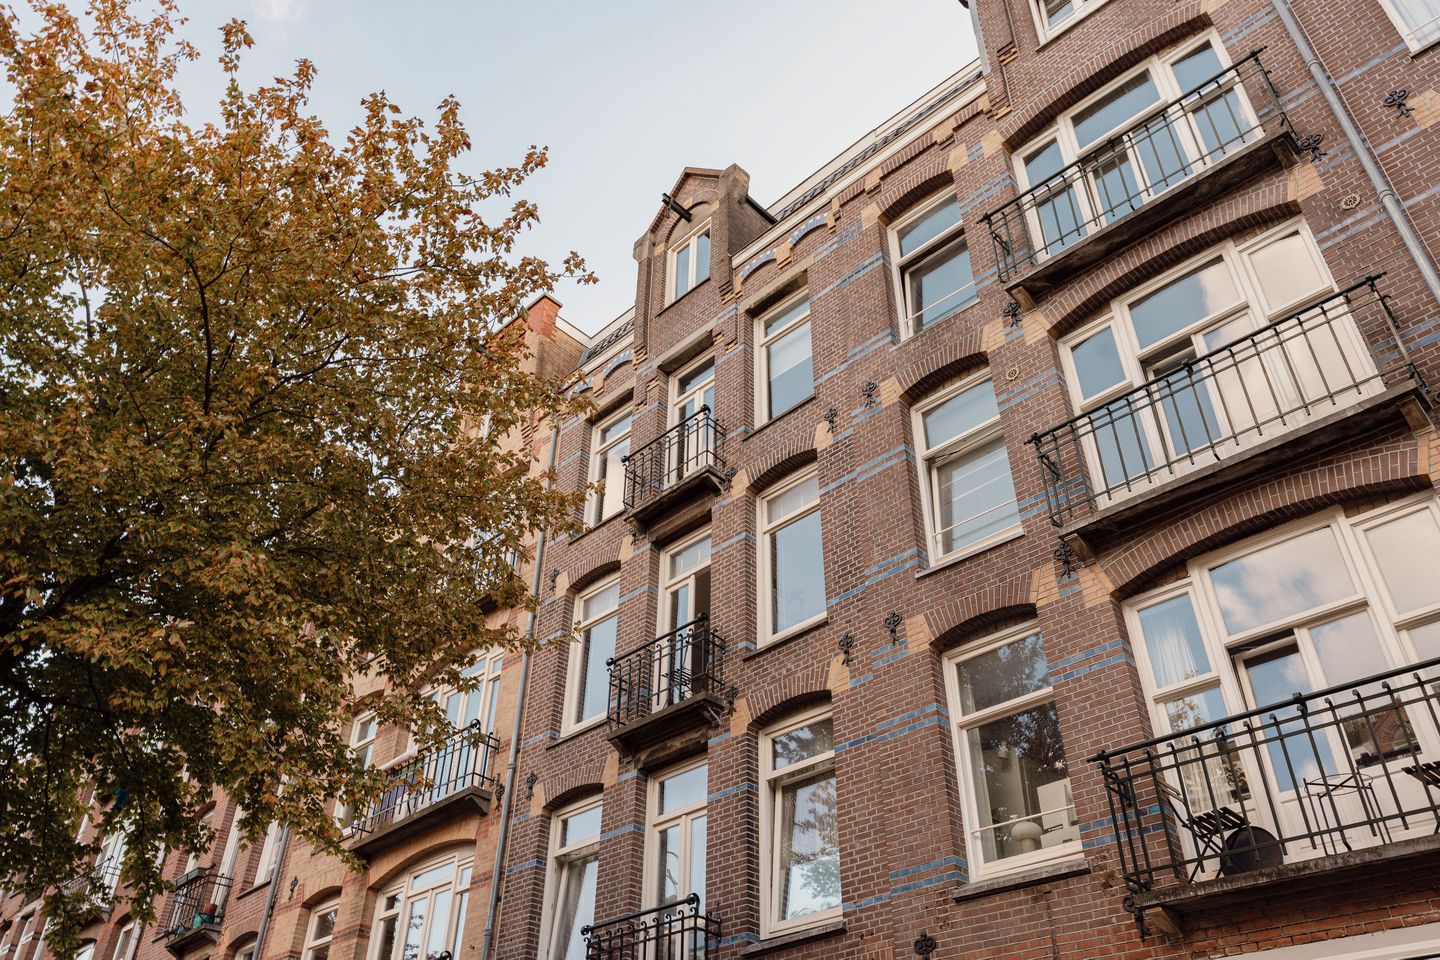
53% of dwellings were built before 1945, against 38% in the municipality of Amsterdam.
Before 194553%
1965-19740.1%
1975-199129.7%
1992-20058.5%
2006-20154.2%
2016 and later4.5%
Explanation
Based on 6,662 dwellings with a registered construction year in the BAG (verblijfsobjecten whose pand has no usable bouwjaar, such as 1005 or 9999, are excluded).
Source: Kadaster BAG (bag-light.gpkg) 2026-09-01
02 · For sale
50 homes for sale now
Asking prices from €315,000 to €895,000; median €8,333 per m². Asking prices, not sale prices.
Less registered crime per resident than the Amsterdam average.
In 2025, 50 crimes per 1,000 residents were registered in Indische Buurt-West, 42% lower than in Amsterdam (86). Since 2023 the registered rate per 1,000 residents fell 6%, against a fall of 3% in Amsterdam. Crimes are counted where they happen, not where the offender lives.
Key figures
Crimes per 1,000 residents, 2025
50
▼42% lower than Amsterdam (86)
Change since 2023
-6%
▼lower than Amsterdam (-3%)
Home burglary per 1,000 dwellings
2.5
▼26% lower than Amsterdam (3.4)
Crimes per 1,000 residents, 2025
50
▼42% lower than Amsterdam (86)
Change since 2023
-6%
▼lower than Amsterdam (-3%)
Home burglary per 1,000 dwellings
2.5
▼26% lower than Amsterdam (3.4)
Registered crimes per 1,000 residents, 2025
In 2025, Indische Buurt-West registered 50 crimes per 1,000 residents, against 86 in the municipality of Amsterdam.
Indische Buurt-West50
The municipality of Amsterdam86
Explanation
Crime is counted where it happens and divided by the number of residents, so places with many visitors — city centres, nightlife, stations — score higher.
The largest category in Indische Buurt-West is 'Theft and burglary': 28.1 per 1,000 residents in 2025, against 47.9 in the municipality of Amsterdam.
Indische Buurt-WestAmsterdam
Theft and burglary28.1
Amsterdam 47.9▼ −41% vs Amsterdam
Traffic6.3
Amsterdam 9.5▼ −34% vs Amsterdam
Violence and threats4.9
Amsterdam 9.2▼ −47% vs Amsterdam
Vandalism and public order4.8
Amsterdam 8.8▼ −45% vs Amsterdam
Fraud and scams4.2
Amsterdam 6.0▼ −30% vs Amsterdam
Other and withheld1.2
Amsterdam 3.9▼ −69% vs Amsterdam
Environmental0.2
Amsterdam 0.4≈ Amsterdam
Explanation
Four categories are structurally withheld at buurt level (sex offences, child pornography, child prostitution, other integrity offences); the gap with the published total is shown under 'other'.
In 2024, police in Indische Buurt-West registered 24 traffic accidents, of which 9 with injury and none fatal.
2020
2021
2022
2023
2024
FatalInjuryMaterial damage only
Explanation
Registered accidents (BRON, Rijkswaterstaat); material-damage-only accidents have not been systematically registered since roughly 2010 and are not comparable between areas. This area shows only accidents with an exactly known location (roughly 80-85% of all registered accidents); the rest is known only at street, intersection or gemeente level. The comparison with the gemeente therefore also uses only the gemeente's exactly-located accidents, which is why that figure is lower than on the gemeente's own page.
Source: BRON — Bestand geRegistreerde Ongevallen Nederland (Rijkswaterstaat) 2024
04 · Living environment
Residents rate their health below the Amsterdam average.
An estimated 69% of adults in Indische Buurt-West rate their own health as good, 3 percentage points less than in Amsterdam. More adults report anxiety or depression (61% against 57%), more smoke (24% against 22%), more drink excessively (8% against 7%) and more feel lonely (55% against 54%).
Key figures
Self-rated health (estimated)
69%
▼3 percentage points lower than Amsterdam (72%)
More figures
Anxiety or depression feelings
61%
▲4 percentage points higher than Amsterdam (57%)
Smokes
24%
▲2 percentage points higher than Amsterdam (22%)
Meets physical activity guideline
59%
▲1 percentage point higher than Amsterdam (58%)
Lonely
55%
▲1 percentage point higher than Amsterdam (54%)
Health
An estimated 69% of adults rate their own health as good, against 72% in the municipality of Amsterdam (2024).
This areaThe municipality of Amsterdam
Good self-rated health
69.2%
72.3%
Smokes
23.6%
21.7%
Excessive drinking
7.5%
7.2%
Overweight
42.5%
42.5%
Lonely
55%
54.2%
Anxiety or depression feelings
60.7%
56.6%
Meets physical activity guideline
59.3%
57.7%
Explanation
An RIVM model estimate (small-area estimation from the 2024 Health Monitor for Adults and Elderly), not a direct tabulation — even a buurt that was not itself surveyed gets an estimate. Figures cover adults aged 18 and over.
Source: RIVM/CBS Gezondheidsmonitor Volwassenen en Ouderen (kleine-gebieden-schatting) 2024
05 · Residents
The population is shrinking, while it grows in Amsterdam.
Indische Buurt-West has 11,940 inhabitants (2026), or 25,463 per km² (5.1 times as high as in Amsterdam). Between 2023 and 2026 the population fell 3%, against a rise of 3% in Amsterdam. In the 2025 House of Representatives (Tweede Kamer) election, turnout in the municipality of Amsterdam was 71%, 7 percentage points below the national 78%. Of the parties that are largest nationally, GROENLINKS / Partij van de Arbeid (PvdA) had the highest share there: 27% of the vote, against 13% nationally. Election results exist only per municipality, so these are the municipality's figures.
Key figures
Population growth since 2023
-3%
▼lower than Amsterdam (+3%)
Turnout, municipality of Amsterdam
71%
▼7 percentage points lower than the Netherlands (78%)
More figures
Growth of the dwelling stock
+0%
▼lower than Amsterdam (+3%)
Aged 25 to 45
43%
▲6 percentage points higher than Amsterdam (37%)
Never married
69%
▲4 percentage points higher than Amsterdam (65%)
Origin outside Europe
49%
▲6 percentage points higher than Amsterdam (43%)
Higher education (hbo, wo)
52%
▲2 percentage points higher than Amsterdam (50%)
GROENLINKS / Partij van de Arbeid (PvdA), share of the vote
27%
▲14 percentage points higher than the Netherlands (13%)
Population per year
The population shrank 3% between 2023 and 2026, to 11,940.
Residents, 2026
11,940
-3% since 2023
Amsterdam +3%
Source: CBS Kerncijfers wijken en buurten (KWB) 2026
Density
With 25,463 residents per km², this wijk is 5.1 times as densely populated as the municipality of Amsterdam.
Residents per km²25,463
Dwellings per km²14,280.9
Source: CBS Kerncijfers wijken en buurten (KWB) 2026
Births and deaths per 1,000 residents
In 2025, 10.0 children were born per 1,000 residents; 4.2 died per 1,000.
2023
2024
2025
BirthsDeaths
Source: CBS Kerncijfers wijken en buurten (KWB) 2025
Residents by age group
43% of residents are between 25 and 45.
0 to 151,265
15 to 251,400
25 to 455,090
45 to 652,700
65 to 801,260
80 and over225
Source: CBS Kerncijfers wijken en buurten (KWB) 2026
Marital status
69% of residents are never married.
Never married8,200
Married2,515
Divorced970
Widowed250
Source: CBS Kerncijfers wijken en buurten (KWB) 2026
Residents by country of origin
49% of residents have origin outside Europe.
Netherlands4,190
Europe (excluding the Netherlands)1,935
Outside Europe5,815
Source: CBS Kerncijfers wijken en buurten (KWB) 2026
Education level of residents aged 15 to 75
52% of residents have a higher professional (hbo) or university (wo) education.
Primary, vmbo, mbo12,500
Havo, vwo, mbo2-42,450
Higher professional, university5,350
Source: CBS Kerncijfers wijken en buurten (KWB) 2024
Parliamentary election
These figures are for the whole municipality of Amsterdam; there is no result per buurt or wijk. At the general election (Tweede Kamer) of 29 October 2025, 71% of eligible voters in Amsterdam voted. The largest party was GROENLINKS / Partij van de Arbeid (PvdA) with 27% of the valid votes.
Municipality of AmsterdamThe Netherlands
D66
23.9%
16.9%
PVV (Partij voor de Vrijheid)
6.9%
16.7%
VVD
9.7%
14.2%
GROENLINKS / Partij van de Arbeid (PvdA)
27.1%
12.8%
CDA
3.9%
11.8%
JA21
2.6%
5.9%
Forum voor Democratie
2%
4.5%
BBB
0.7%
2.6%
Other
23.2%
14.4%
Explanation
Official election result (Kiesraad), top 8 parties by national vote count plus 'Other'; share of valid votes. A voter may vote at any polling station in their own gemeente; there is therefore no reliable buurt- or wijk-level result. This figure is the whole gemeente's own result.
Source: Kiesraad — Verkiezingsuitslag Tweede Kamer (data.overheid.nl) TK2025
06 · More figures
More figures
Indische Buurt-West has an average of 0.3 cars per household, 40% lower than in Amsterdam (0.5). 23% of cars run on something other than petrol (diesel, LPG or electricity, hybrids included), 8 percentage points less than in Amsterdam (31%).
Key figures
Culture, recreation and other services, share of businesses
21%
▲6 percentage points higher than Amsterdam (15%)
Financial services and real estate, share of businesses
1%
▼3 percentage points lower than Amsterdam (4%)
Industry and energy, share of businesses
5%
▼2 percentage points lower than Amsterdam (7%)
Cars per household (2025)
0.3
▼40% lower than Amsterdam (0.5)
Cars not on petrol (2025)
23%
▼8 percentage points lower than Amsterdam (31%)
Change in cars not on petrol since 2023
+3 pp
▼lower than Amsterdam (+4 pp)
Residential, share of addresses
95%
▲4 percentage points higher than Amsterdam (91%)
Industrial, share of addresses
1%
▼1 percentage point lower than Amsterdam (2%)
Office, share of addresses
2%
=about the same as Amsterdam (2%)
Multi-family dwellings
100%
▲63 percentage points higher than the Netherlands (37%)
Owner-occupied dwellings
30%
▼27 percentage points lower than the Netherlands (57%)
Social housing
53%
▲25 percentage points higher than the Netherlands (28%)
Business establishments by sector
Zakelijke dienstverlening is the largest sector, with 725 establishments.
Landbouw, bosbouw en visserij0
Nijverheid en energie115
Handel en horeca330
Vervoer, informatie en communicatie330
Financiële diensten, onroerend goed35
Zakelijke dienstverlening725
Overheid, onderwijs en zorg390
Cultuur, recreatie, overige diensten505
Source: CBS Kerncijfers wijken en buurten (KWB) 2025
Passenger cars by fuel type
23% of passenger cars do not run on petrol (diesel, LPG, electric etc.), against 31% in the municipality of Amsterdam (2025).
Petrol77.4%
Other fuel (diesel, LPG, electric etc.)22.6%
Explanation
CBS splits passenger cars into 'petrol' and 'other fuel' only. That second category bundles diesel, LPG, electric (including hybrid), hydrogen, alcohol, LNG and CNG together — CBS publishes no separate electric-car count per buurt, wijk or gemeente, so this is not the same as an 'electric share'.
Source: CBS Kerncijfers wijken en buurten (KWB) 2025
Share on other fuel per year
The share of passenger cars not running on petrol went from 20% to 23% between 2023 and 2025.
Share on other fuel, 2025
23%▼ 8 percentage points below Amsterdam (31%)
+3 pp since 2023
Amsterdam +4 pp
Explanation
See the 'Passenger cars by fuel type' card for what 'other fuel' covers — this is not the share of electric cars.
Source: CBS Kerncijfers wijken en buurten (KWB) 2025
Vehicles by kind
In 2025, 2,205 passenger cars and 245 motorcycles were registered here.
Passenger cars2,205
Motorcycles245
Explanation
At this level CBS publishes only passenger cars and motorcycles, no vans or trucks.
Source: CBS Kerncijfers wijken en buurten (KWB) 2025
Addresses by building use
95% of addresses are residential; the largest other use is retail (2%).
Residential94.5%
Retail1.9%
Office1.5%
Assembly1%
Healthcare0.3%
Industrial0.8%
Education0.1%
Other0.3%
Explanation
Based on 7,049 verblijfsobjecten in use. An object with several registered uses (e.g. a flat above a shop) is counted under each of them, so the shares can add up to more than 100%.
Source: Kadaster BAG (bag-light.gpkg) 2026-09-01
Biggest difference from the Netherlands
25,463 residents per km²: 47 times as densely populated as the Dutch average.
This areaThe Netherlands
Residents per km²25,463
NL 539▲ +4624% vs NL
Multi-family dwellings100%
NL 37%▲ +170% vs NL
Owner-occupied dwellings30%
NL 57%▼ −47% vs NL
Social housing53%
NL 28%▲ +89% vs NL
Private rent17%
NL 14%▲ +21% vs NL
Explanation
The 5 characteristics that differ most from the national average, ranked by log ratio (so a halving and a doubling count as equally different); the shown percentage is the ordinary difference against the Netherlands.
Source: CBS Kerncijfers wijken en buurten (KWB) 2026